Calculated Risk

Retail Sales Increased 0.7% in March

On a monthly basis, retail sales were up 0.7% from February to March (seasonally adjusted), and sales were up 4.0 percent from March 2023.

From the Census Bureau report:
Advance estimates of U.S. retail and food services sales for March 2024, adjusted for seasonal variation and holiday and trading-day differences, but not for price changes, were $709.6 billion, up 0.7 percent from the previous month, and up 4.0 percent above March 2023. ... The January 2024 to February 2024 percent change was revised from up 0.6 percent to up 0.9 percent.
emphasis added
Retail Sales Click on graph for larger image.

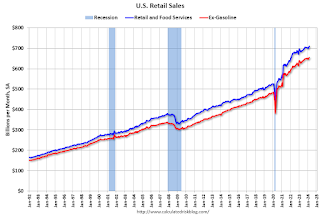
This graph shows retail sales since 1992. This is monthly retail sales and food service, seasonally adjusted (total and ex-gasoline).

Retail sales ex-gasoline were up 0.6% in March.

The second graph shows the year-over-year change in retail sales and food service (ex-gasoline) since 1993.

Retail and Food service sales, ex-gasoline, increased by 4.4% on a YoY basis.

Year-over-year change in Retail Sales The increase in sales in March was above expectations, and, sales in January and February were revised up.

Housing April 15th Weekly Update: Inventory up 2.6% Week-over-week, Up 29.6% Year-over-year

Altos reports that active single-family inventory was up 2.6% week-over-week. Inventory bottomed in mid-February this year, as opposed to mid-April in 2023, and inventory is now up 5.6% from the February bottom.
Altos Home Inventory Click on graph for larger image.

This inventory graph is courtesy of Altos Research.
As of April 12th, inventory was at 526 thousand (7-day average), compared to 513 thousand the prior week.   
Inventory is still far below pre-pandemic levels. 
The second graph shows the seasonal pattern for active single-family inventory since 2015.
Altos Year-over-year Home Inventory
The red line is for 2024.  The black line is for 2019.  Note that inventory is up almost double from the record low for the same week in 2022, but still well below normal levels.
Inventory was up 29.6% compared to the same week in 2023 (last week it was up 24.6%), and down 38.2% compared to the same week in 2019 (last week it was down 38.7%). 
Back in June 2023, inventory was down almost 54% compared to 2019, so the gap to more normal inventory levels is slowly closing.
Mike Simonsen discusses this data regularly on Youtube.

Monday: Retail Sales, NY Fed Mfg, Homebuilder Survey

Weekend:
Schedule for Week of April 14, 2024

Monday:
• At 8:30 AM ET, Retail sales for March is scheduled to be released.  The consensus is for a 0.3% increase in retail sales. 

• Also at 8:30 AM, The New York Fed Empire State manufacturing survey for April. The consensus is for a reading of -9.0, up from -20.9.

• At 10:00 AM, The April NAHB homebuilder survey. The consensus is for a reading of 51, unchanged from 51.  Any number above 50 indicates that more builders view sales conditions as good than poor.

From CNBC: Pre-Market Data and Bloomberg futures S&P 500 are up 14 and DOW futures are up 78 (fair value).

Oil prices were up over the last week with WTI futures at $85.66 per barrel and Brent at $90.45 per barrel. A year ago, WTI was at $83, and Brent was at $87 - so WTI oil prices are up slightly year-over-year.

Here is a graph from Gasbuddy.com for nationwide gasoline prices. Nationally prices are at $3.61 per gallon. A year ago, prices were at $3.65 per gallon, so gasoline prices are down $0.04 year-over-year.

By Request: Public and Private Sector Payroll Jobs During Presidential Terms

Note: I used to post this monthly, but I stopped during the COVID-19 pandemic. I've received a number of requests lately to post this again, so here is another update of tracking employment during Presidential terms.  We frequently use Presidential terms as time markers - we could use Speaker of the House, Fed Chair, or any other marker.

Important: There are many differences between these periods. Overall employment was smaller in the '80s, however the participation rate was increasing in the '80s (younger population and women joining the labor force), and the participation rate is generally declining now.  But these graphs give an overview of employment changes.

The first graph shows the change in private sector payroll jobs from when each president took office until the end of their term(s). Presidents Carter, George H.W. Bush and Trump only served one term.

Mr. G.W. Bush (red) took office following the bursting of the stock market bubble and left during the bursting of the housing bubble. Mr. Obama (dark blue) took office during the financial crisis and great recession. There was also a significant recession in the early '80s right after Mr. Reagan (dark red) took office.

There was a recession towards the end of President G.H.W. Bush (light purple) term, and Mr. Clinton (light blue) served for eight years without a recession.   And there was a pandemic related recession in 2020.

First, here is a table for private sector jobs. The previous top two private sector terms were both under President Clinton.  

TermPrivate Sector
Jobs Added (000s) Biden13,7351 Clinton 110,876 Clinton 210,094 Obama 29,926 Reagan 29,351 Carter9,039 Reagan 15,363 Obama 11,907 GHW Bush1,507 GW Bush 2443 GW Bush 1-820 Trump-2,192 1After 38 months.
Private Sector Payrolls Click on graph for larger image.

The first graph is for private employment only.

Private sector employment increased by 9,039,000 under President Carter (dashed green), by 14,714,000 under President Reagan (dark red), 1,507,000 under President G.H.W. Bush (light purple), 20,970,000 under President Clinton (light blue), lost 377,000 under President G.W. Bush, and gained 11,833,000 under President Obama (dark dashed blue).  During Trump's term (Orange), the economy lost 2,135,000 private sector jobs.
In the first 38 months of President Biden's term (Blue), the economy has added 13,735,000 private sector jobs, as the economy recovered from the pandemic.

Public Sector Payrolls A big difference between the presidencies has been public sector employment.  Note: the bumps in public sector employment due to the decennial Census in 1980, 1990, 2000, 2010 and 2020. 

The public sector grew during Mr. Carter's term (up 1,304,000), during Mr. Reagan's terms (up 1,414,000), during Mr. G.H.W. Bush's term (up 1,127,000), during Mr. Clinton's terms (up 1,934,000), and during Mr. G.W. Bush's terms (up 1,744,000 jobs).  However, the public sector declined significantly while Mr. Obama was in office (down 263,000 jobs).  During Trump's term, the economy lost 528,000 public sector jobs.
In the first 38 months of President Biden's term, the economy has added 1,482,000 public sector jobs (about 93% of public job growth has been for state and local governments, and about 56% for education).
And a table for public sector jobs. Public sector jobs increased have increased the most during Biden's term, just ahead of the number during Reagan's 2nd term.  Public sector jobs declined the most during Obama's first term.

TermPublic Sector
Jobs Added (000s) Biden1,4821 Reagan 21,438 Carter1,304 Clinton 21,242 GHW Bush1,127 GW Bush 1900 GW Bush 2844 Clinton 1692 Obama 2447 Reagan 1-24 Trump-528 Obama 1-710 1After 36 months.

Real Estate Newsletter Articles this Week: Current State of the Housing Market

Schedule for Week of April 14, 2024

The key reports this week are March Retail Sales, Housing Starts and Existing Home Sales.

For manufacturing, the March Industrial Production report, and NY and Philly Fed surveys will be released this week.

----- Monday, April 15th -----
Year-over-year change in Retail Sales 8:30 AM: Retail sales for March is scheduled to be released.  The consensus is for a 0.3% increase in retail sales. 

This graph shows the year-over-year change in retail sales and food service (ex-gasoline) since 1993. Retail and Food service sales, ex-gasoline, increased by 2.0% on a YoY basis in February.

8:30 AM: The New York Fed Empire State manufacturing survey for April. The consensus is for a reading of -9.0, up from -20.9.

10:00 AM: The April NAHB homebuilder survey. The consensus is for a reading of 51, unchanged from 51.  Any number above 50 indicates that more builders view sales conditions as good than poor.

----- Tuesday, April 16th -----
Multi Housing Starts and Single Family Housing Starts8:30 AM ET: Housing Starts for March.

This graph shows single and multi-family housing starts since 1968.

The consensus is for 1.480 million SAAR, down from 1.521 million SAAR in February.

Industrial Production 9:15 AM: The Fed will release Industrial Production and Capacity Utilization for March.

This graph shows industrial production since 1967.

The consensus is for a 0.4% increase in Industrial Production, and for Capacity Utilization to increase to 78.5%.

----- Wednesday, April 17th -----
7:00 AM ET: The Mortgage Bankers Association (MBA) will release the results for the mortgage purchase applications index.

2:00 PM: the Federal Reserve Beige Book, an informal review by the Federal Reserve Banks of current economic conditions in their Districts.

----- Thursday, April 18th -----
8:30 AM: The initial weekly unemployment claims report will be released.  The consensus is for 217 thousand initial claims, up from 211 thousand last week.

8:30 AM: the Philly Fed manufacturing survey for April. The consensus is for a reading of 0.0, down from 3.2.

Existing Home Sales10:00 AM: Existing Home Sales for March from the National Association of Realtors (NAR). The consensus is for 4.20 million SAAR, down from 4.38 million.

The graph shows existing home sales from 1994 through the report last month.

----- Friday, April 19th -----
10:00 AM: State Employment and Unemployment (Monthly) for March 2024

Pages