New Deal democrat's blog

The Deflationary Bust Deepens: May 2009 edition

This morning the BLS reported that consumer inflation increased +0.1% (seasonally adjusted) in May, (rising 0.3% non-seasonally adjusted). Year-over-year prices have fallen -1.3% into deflation. YoY consumer deflation is only surpassed by 1949 in the post-Depression era.

The first 5 months of inflation data are still in accord with the optimistic scenario I laid out in January:

In the Optimistic scenario, the fiscal and monetary stimuli, together with intelligent new political leadership in Washington, halt the meltdown perhaps by mid-year, and wage reductions remain the exception. In the Pessimistic scenario, the stimuli fail, and wage reductions spread, leading to a wage-price deflationary spiral.

May Leading Economic Indicators (2)

Over a week ago, I promised a follow up post on May's Leading Economic Indicators. Real life intervened, so, tardily, here it is.

April's LEI were the most strongly positive indicators in 2 years, and the first batch of readings for May were similarly positive. By June 1, we already knew that, by weight over 50% of the indicators would be positive. Real money supply was still strong as the Fed continues to re-liquify (or re-solvenc-fy) the banking system. The yield curve was even more strongly positive than before, due to the backup in long term rates while short term rates are still essentially 0%. Stock prices (over the last 90 days) also strongly rallied. Consumer expectations about the future is rising sharply. Average initial claims for unemployment insurance were basically flat for the month. By weight, that's 52% positive, and 3% neutral.

So May's data started out looking very positive. As we shall see, the suckerpunch was saved for the end.

Henry C. K. Liu of the Asia Times: It's a Global Wage Crisis

H/t to Bigchin who sent me a link to an Asia Times column by Henry C. K. Liu:

"the Fed's new money has not been going to consumers in the form of full employment with rising wages to restore fallen demand, but instead is going only to debt-infested distressed institutions to allow them to deleverage from toxic debt. Thus deflation in the equity market (falling share prices) has been cushioned by newly issued money, while aggregate wage income continues to fall to further reduce aggregate demand.

Oil, the Dollar, and Speculation

Here I was, with a nice polite post set to print, when I read the related links to this article at Naked Capitalism. And what do they all say? "Oil is surging because the dollar is tanking."

So excuse me, but I have to toss the politeness out the window and shout, "IT'S NOT THE DOLLAR, STUPID!!!" Here's a graph from Worthwhile Canadian Initiative including a variety of currencies, just against Oil:

OK, smartypants, if it's all about the dollar, then why is the price of Oil surging in EVERY CURRENCY??? And don't give me that "Peak Oil" cr**....

May Leading Economic Indicators (1)

As Calculated Risk points out, economic cycles typically run in an order. The first portions of the economy to turn positive are typically personal consumption expenditures and residential investment -- even during the recession. Afterward, investment in durable goods such as equipment and software. Finally, after the recession (in terms of GDP bottom), unemployment and non-residential investment.

Research has shown that most economic pundits miss turning points because they just project past and current trends into the future. The best way to look into the economic future is usually just to look at the Conference Board's Index of Leading Economic Indicators.

In April, Leading Economic Indicators surged 1% as 8 out of the 10 turned positive or at least neutral. With May over, let's take a preliminary look at what those indicators might show.

Guess Who Said This:

Brad Delong "hoists the jolly roger" posting a pdf of an entire speech given by Jacob Viner, one of the original economics professors at the Chicago School. He needn't have done so, since the essence of Viner's argument (that deficit spending + deliberately-caused inflation was the correct way to fight the Great Depression) has already been discussed within the realm of fair use by others. The brain-teaser is, who is the person who cites Viner approvingly? Here's the quote:

Even more pertinent is a talk Viner delivered in Minneapolis on February 20, 1933, on 'Balanced Deflation, Inflation, or More Depression' (Viner 1933). While agreeing with Robbins on the harm done by wage and price rigidity, and in particular by the Hoover Administration pressure against wage reductions, he also spoke vigorously against letting the cure take its course:

'We have already had three years of patient waiting, probably three years too much. It is arguable that even dangerous remedies now threaten less risk of disaster than does continuance of inaction.'

Consumers believe in "green shoots" ... but aren't spending like it

Bloomberg reports that:

Confidence among U.S. consumers rose this month to the highest level since September, reinforcing signs that the worst recession in half a century is abating.
….
“Consumers are looking at things like the rise in stocks, they are listening to reports talking abut ‘green shoots’ and they believe it,” Chris Low, chief economist at FTN Financial in New York said in an interview with Bloomberg Television. “They believe that a recovery is coming but they don’t see it in their current job prospects.”
….
The Reuters/University of Michigan index of consumer expectations for six months from now, which more closely projects the direction of consumer spending, rose to 69.4 in May from 63.1 the prior month.

Stocks vs. Bonds in Kondratieff Autumn vs. Winter

Andy Bebut, a/k/a Theroxylandr, has this post at his blog describing an important relationship between stocks and bonds:

Back in 2007 I was writing that during the Kondratieff Spring, Summer and Autumn Treasury bonds and stocks are trading generally in the same direction, with bonds leading. During the Winter they are trading in opposite direction.

Andy's full blog is as always well worth reading, but I wanted to elaborate on the important difference in how stocks and bonds have behaved during the last 10+ years, vs. how they behaved during the great bull market of the 1980s and 1990s.

No Long-term Recovery without real Wage Growth

In my recent series, Economic Indicators during the Roaring Twenties and Great Depression, I concluded that the indicators that were studied from the Deflationary period of 1920-1950 suggested that this recession might bottom out in about Q3 2009. But with anemic wage growth to say the least, such a weakly based recovery might be doomed at birth to be short-lived.

All the deflationary recessions from 1920 - 1950 followed a pattern. The CPI declined from the beginning of the recession and its YoY rate of decline bottomed immediately before the recession's end. M1 money supply followed a similar pattern, sometimes coincidentally, sometimes leading slightly. In all 6 of the deflationary recessions during the period of 1920-50, once M1 and CPI both declined at a decreasing rate, the recession was about to end.

Do We Need another WPA?

This is a joint article I wrote with Bonddad

Regardless of when this recession ends, the malaise of working and middle class America will not be relieved until wages increase, and employment rates return to a robust level. Since unemployment is a lagging indicator, the news on that score is grim. Almost every analyst believes that there will be another "jobless recovery" such as those that followed the 1990 and 2001 recessions. Even after GDP bottomed and those recessions technically ended, there was an average 17 month increase in unemployment of .9% (or a 15% percent increase in the rate) followed by a 13.5 month decrease back to the rate at the "bottom" of the recession. If that pattern holds true again, then even if this recession bottoms shortly, unemployment will be 10.1% by July, rise to 11.3% by December 2010, and take until at least early 2012 to decrease back under 10%, looking like this graph:


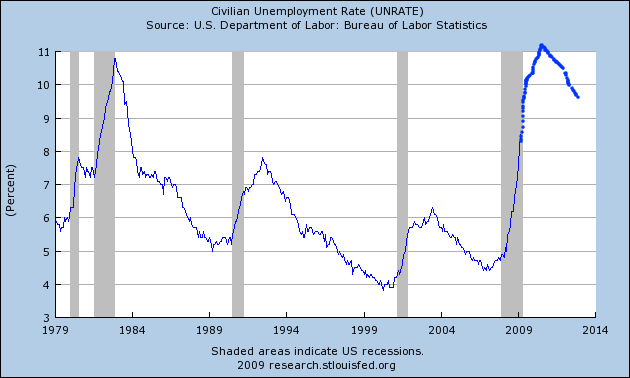
Note this is U3 unemployment, so U6 unemployment will be correspondingly worse.

Pages