
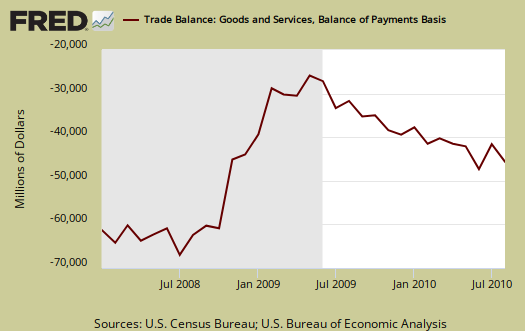
The August 2010 U.S. trade deficit increased to $46.347 billion. July's revised deficit was $42.583 billion. The goods deficit with China alone increased $2.1 billion. That's an 8.84% U.S. trade deficit increase in one month. U.S. exports increased by a measly $0.3 billion, to $153.5 billion, while imports increased by $4.1 billion, to $200.2 billion.
Imports are now 1.33 times larger than exports, or in other words, for every $3 we export, we import $4 worth of stuff. From the report:
Exports were up $23.5 billion, or 18.0 percent, and imports were up $38.8 billion, or 24.0 percent.
Below are imports vs. exports of goods and services from January 2007 to August 2010. Notice how imports are increasing so much faster than exports and also notice how much larger imports are than exports.

The change was almost all goods and on U.S. goods exports, it's unchanged. From the report:
In August, the goods deficit increased $3.9 billion from July to $59.0 billion, and the services surplus increased $0.1 billion to $12.6 billion. Exports of goods were virtually unchanged at $107.7 billion, and imports of goods increased $3.9 billion to $166.7 billion. Exports of services increased $0.3 billion to $46.2 billion, and imports of services increased $0.2 billion to $33.5 billion.
The largest increase in imports was consumer goods, $1.4 billion.
Advanced technology, ya know those jobs of the future, has a deficit of $8.8 billion and to make matters worse in one month a drop in exports of $2.1 billion. That's American jobs, the jobs of the future, being offshore outsourced and now the goods are coming in as imports.
Advanced technology products exports were $21.8 billion in August and imports were $30.6 billion, resulting in a deficit of $8.8 billion. August exports were $2.1 billion less than the $23.9 billion in July, while August imports were $0.2 billion less than the $30.8 billion in July.
Here is the breakdown with major trading partners. China alone is a $28 billion dollar trade deficit. The trade deficit with China exceeds the next largest trading partner, OPEC (read oil), by over over 3 to 1.
The August figures show surpluses, in billions of dollars, with Hong Kong $1.9 ($1.8 for July), Singapore $1.1 ($1.2), Australia $1.0 ($0.9), and Egypt $0.4 ($0.4). Deficits were recorded, in billions of dollars, with China $28.0 ($25.9), OPEC $9.0 ($8.0), European Union $8.1 ($9.9), Mexico $6.0 ($5.3), Japan $5.8 ($4.9), Germany $3.4 ($3.6), Nigeria $2.7 ($2.4), Ireland $2.5 ($2.4), Venezuela $2.2 ($1.8), Canada $2.2 ($1.4), Korea $1.3 ($1.0), and Taiwan $1.2 ($1.0).
Below is the raw customs basis accounting of Chinese imports into the United States, not seasonally adjusted.
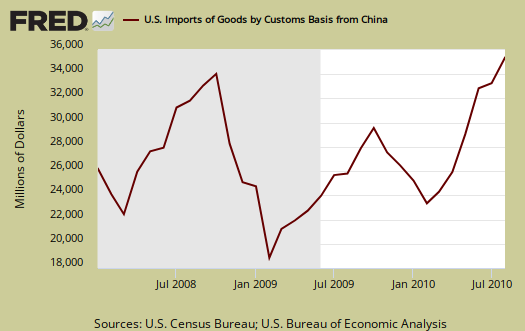
Below is a graph of China imports into the United States from 1985, to show just how much imports from China have grown. The visual is stunning, it looks like a rocket pointed directly at the U.S. economy.

The trade deficit, a major U.S. jobs buster, is well on it's same trajectory path, before the great recession like a nuclear missile, against the United States.
What is the U.S. exporting? Soybeans and Gold. Know what has dropped dramatically in U.S. exports? Non-military aircraft.
Ya know what the U.S. is importing more of? Semiconductors, that's advanced technology manufacturing, The top consumer good import is cheap plastic toys and cheap plastic stuff for the house.
To get a feel for what's going on in terms of imports and exports by end-use categories, I suggest looking over exhibits 7 & 8 from the trade report.
Here is July's report (unrevised).
Subject Meta:
Forum Categories:
| Attachment | Size |
|---|---|
| 417.65 KB |
Really good report! In my
Really good report! In my opinion, the number of 46,3 $ billion presents one of the biggest risks at the very moment. “The largest increase in imports was consumer goods, $1.4 billion” – it´s a very important finding, because consumer goods initializes the sophisticated mechanism of increase GDP or also an inflation. On the other hand, poor export is not a hopeful signal for the balanced budget.
Consumer goods vs. Consumer, PCE in GDP
The trade deficit removed -3.50 percentage points to our lovely 1.7% Q2 2010 GDP. In other words, without the trade deficit Q2 2010 GDP would have been 5.2%. The change to GDP from just imports in Q2 2010 was 16.9%.
So, while you may believe PCE, or C, is 70% of the U.S. economy (GDP) and it is....
and thus increased consumer goods does imply retailers are expecting purchases to rise (and the trade deficit from China is not seasonally adjusted, but I do not know if those imports are correlated to the Christmas consumer purchase pig fest, black friday run your neighbor down seasonal thing) ....i.e. are these imports timed for the U.S. holiday season?
Yet, from the analysis, the thing that tanked last quarter's GDP was the trade deficit.
I think two scary things are the year-to-year decline in nondefense aircraft exports and the beyond belief increase in semiconductors.
Right there, that's previously U.S. manufacturers, the advanced manufacturing, which used to be done in the U.S., being imported. That's advanced manufacturing and that's just not good, not from a U.S. manufacturing view point, the potential growth in semiconductors, technoogy, advanced manufacturing and how we don't have enough of that pie anymore, and then security issues that goes with technology being offshore outsourced.
I don't like those numbers Sam I am. Advanced manufacturing begets more advanced manufacturing, advanced R&D, "jobs of tomorrow". We need FABS (plants that make computer chips) built in the U.S., advanced R&D, advanced manufacturing in the U.S.
The "C" thing, or consumer, PCE, this is an interesting question that I'll have to dig around more into...
Since it's cheap plastic crap from China coming in as consumer goods....in terms of just the "C" or PCE in GDP, what percentage of that is imports from China?
In other words, we know that the trade deficit walloped last quarter GDP, but how much of imports is negated (in terms of GDP, not in terms of the real economy, because obviously buying cheap plastic toys and plastic bins from China on your MC or VISA card isn't doing much for the real economy beyond keeping Walmart and lowly paid retail blue smock workers going) ...
by consumer purchases, i.e C or PCE?
If you have a credible link on the correlation between consumer goods as imports vs. PCE on a domestic level, I'd like to see it, for ya know, is simply buying a bunch of cheap plastic crap on our plastic cards real economic growth?