
Wondering why we have conflicting reports on the S&P Case-Shiller Housing Index? One financial press source is singing hallelujah while another is glum? Because S&P is using not seasonally adjusted data in their press release and other news outlets are using the seasonally adjusted data. Not seasonally adjusted, the composite-20 index increased 0.7%, but the seasonally adjusted composite-20 housing index decreased -0.1%.
Same situation for the composite-10 index. The not seasonally adjusted composite-10 increased 0.8% from March to April, but seasonally adjusted? That flat-lined, no change.
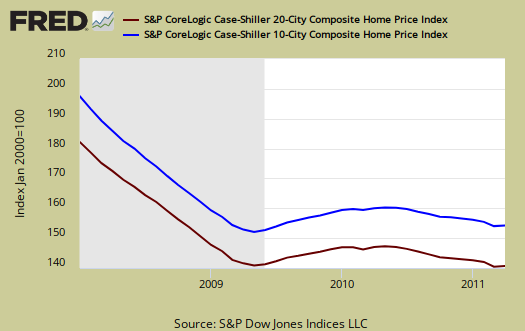
The above graph shows the composite-10 and composite-20 city home prices indexes, seasonally adjusted. Prices are normalized to the year 2000. The index value of 150 means single family housing prices have appreciated, or increased 50% since 2000 in that particular region. These indices are not adjusted for inflation. The composite-20 index, seasonally adjusted is at it's June 2003 low of 148.93. Not seasonally adjusted the composite-20 index is 138.84, only sightly up from it's all time low of 138.16.
The S&P/Case-Shiller Home Price Indices are calculated monthly using a three-month moving average and published with a two month lag. Their seasonal adjustment calculation is the standard used for all seasonal adjustments, the X-12 ARIMA, maintained by the Census.
So, why would S&P report the not seasonally adjusted data, when we all know spring is the start of house buying and building season? According to their paper on seasonal adjustments, they claim the not seasonally adjusted indices are more accurate. Why? It appears the housing bubble and bust has screwed up the cyclical seasonal pattern. What a surprise.
The turmoil in the housing market in the last few years has generated unusual movements that are easily mistaken for shifts in the normal seasonal patterns, resulting in larger seasonal adjustments and misleading results.
Regardless, we believe seasonal data should be reported for headline buzz. It is spring and assuming the housing buying months are not increasing the data is just plain wrong.
S&P does make it clear that data should be compared to a year ago, to remove seasonal patterns, yet claims monthly percentage changes should use not seasonally adjusted indices and data. From Winter to Spring? I don't think so! Below are the seasonally adjusted indices for April 2011.
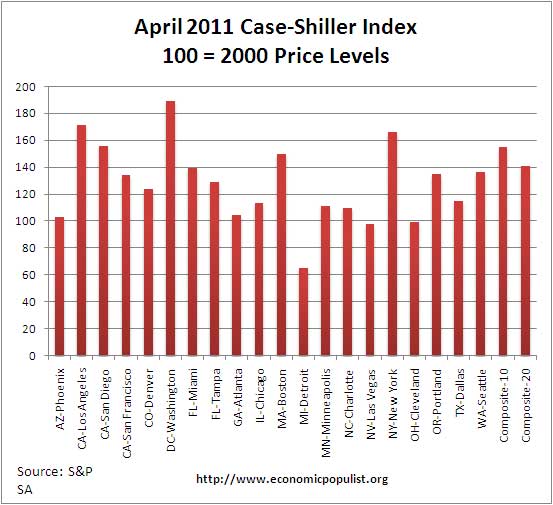
For April 2011, the S&P/Case-Shiller Home Price indexes shows 19 of the 20 cities tracked are down for the year.
It seems the only place going up is our never ending corrupt Washington D.C. area.
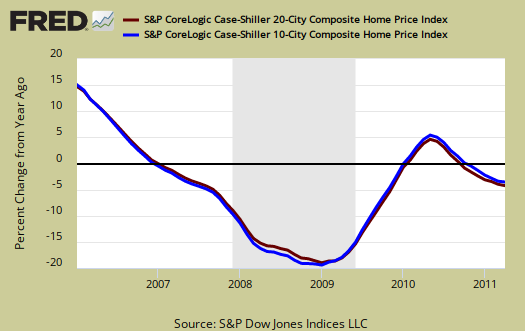
Below is the yearly percent change in the composite-10 and composite-20 Case-Shiller Indices. As you can see, there is clearly a new decline going on for 2011. This is what is meant by double-dip in declining home prices.
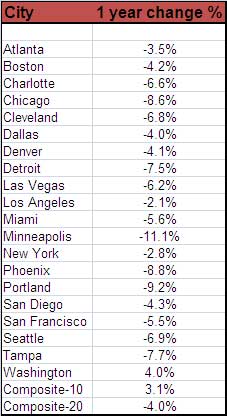
Below is a table are all of the cities of the composite-20 index for their year change. This should give a feel for the bubble and now current devaluations. Notice the stronger correlations in price declines to the unemployment rate and lack of job growth, such as Detroit.
The graph below, from Calculated Risk, shows how much prices have fallen from their peaks in the Composite-10 cities. Calculated Risk has additional custom graphs and data analysis and is the uber site for residential housing data and graphs.
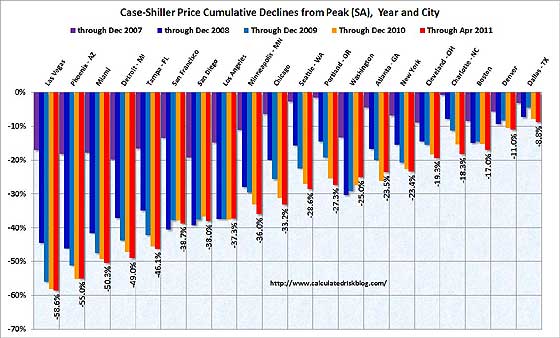
Basically a decade of home appreciation is gone when taking inflation into account.
It's clear foreclosures and distressed sales are simply blowing up seasonal and not seasonal monthly adjustment data. More ominous is the backlog of foreclosures being held off of the market with estimates varying. One report says 2.2 million homes are currently in foreclosure. At the end of Q4 2010, foreclosures were 1.3 million.
Here is the March overview, unrevised.
S&P does a great job of making the Case-Shiller data and details available for further information and analysis on their website.
Recent comments