
The crisis in household finances: total hours worked and real compensation per hour both declined in Q4 and yr/yr ...worse than previously reported.
The details of today’s revised BLS report on Q4 productivity and costs are again very instructive on the state of the economy.
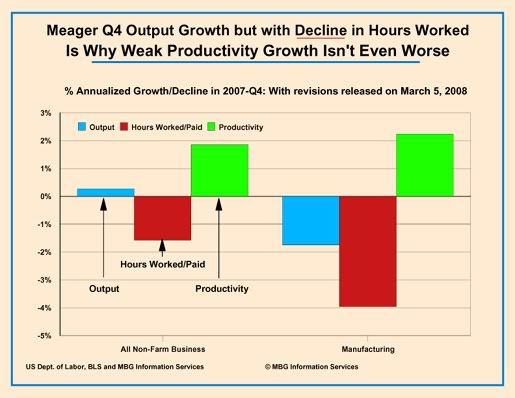
According to the BLS, total non-farm output in 2007-Q4 grew by even less than the BLS had estimated last month; 0.27% annualized growth rather than their earlier estimate of 0.35%. It is important to note this small downward revision to the original estimate of virtual stagnant output because the headline (and virtually only media “reporting”) is that non-farm productivity growth was revised slightly upward from the initial 1.82% annualized rate to 1.85%.
As I repeatedly note, productivity is rightly emphasized as the engine of prosperity but it is essential to appreciate the difference between productivity and output -- or “production” of goods and services. A clear example of the importance of this distinction is the Manufacturing sector that registered annualized productivity growth of 2.24% in 2008-Q4 but suffered a -1.74% decline in actual production. Manufacturing productivity can grow even as production is declining because the total number of hours worked in Manufacturing plunged at a -3.96% rate in 2004-Q4.
Productivity is popularly considered the ability to produce more with less. Unfortunately productivity can also mean producing LESS with FAR LESS hours on the jobs. Productivity is defined as production per hour of work.
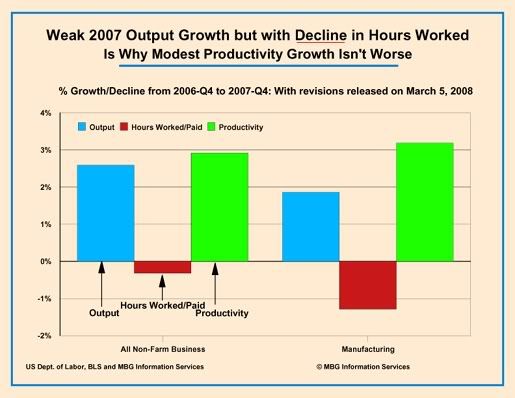
The entire non-farm economy did produce very slightly more in Q4 than in Q3 but it did so with LESS hours of paid work -- -1.57% less work on an annualized basis. Today’s report revises the anemic growth of production down and productivity up because it also revises down even further the decline in hours worked. These revisions are even more meaningful yr/yr with non-farm productivity revised UP to 2.92% (from the initial estimate of 2.64%,) total production revised DOWN to 2.60% (from 2.62%) because total yr/yr hours worked was revised down further to a decline of -0.32% from the initial -0.02%.
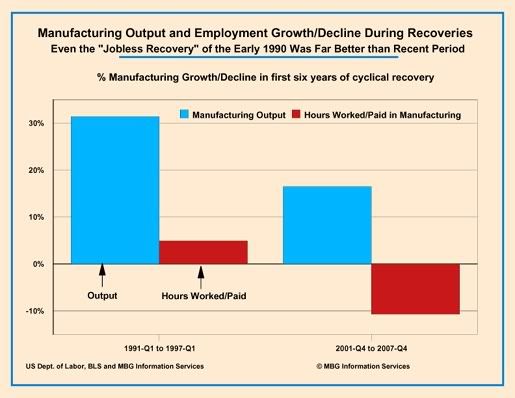
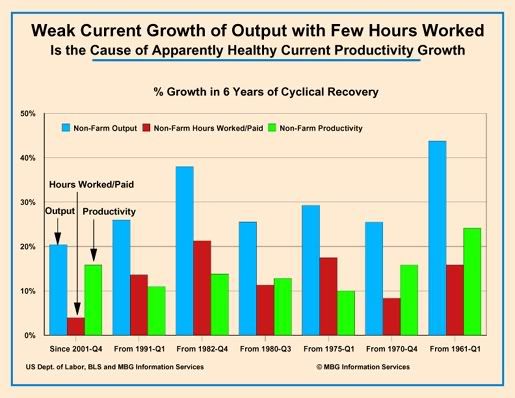
This pattern of historically weak growth in labor hours, with only modest production growth provided misleadingly “normal” productivity growth throughout the past six-years of cyclical “recovery.” (if pictures help, see my below data graphics)
The importance of the sharp decline in total hours worked -- and paid -- in 2008-Q4 (AND YEAR/YEAR!) is compounded by the BLS other finding that price-adjusted compensation PER HOUR WORKED for ALL workers plunged at a -0.45% annualized rate in Q4 and also declined by a slight -0.01% yr/yr. That is, the total US workforce worked fewer hours over the past quarter and year and received less in wages and benefits for each hour worked. And, oh yes, this series does include ALL workers and ALL employer-paid benefits including Wall Street’s lavish bonuses and windfalls from exercised stock options. The “median” wage per hour – and particularly per year, with fewer paid hours – certainly plunged far more than is reflected by these total average figures.
Because few in the major media inform their readers/viewers/listeners about even such vital matters as declining real wages and hours, many who follow these secondary “news” sources continue today confidently making wildly misinformed financial and public policy decisions. These misinformed choices mattered less when debt was “free,” but may have more severe consequences now.
Recent comments