The 2nd Quarter Report on Household Debt and Credit (pdf) from the NY Fed is another of those reports that tells it's story mostly in graphics, although the NY Fed has an accompanying press release and a blog post discussing the rise of subprime auto loans, which now number more than home loans, but have not yet reached the proportions seen before the crisis...much of the detail in this report is not a surprise, ie, that housing related debt is declining and that student loan debt is rising, but in that this broad sweep covers much of the same data we've seen in other reports, such as the G19s on Consumer Credit and the privately issued LPS Mortgage Monitor, it's interesting to put bring it all type of debt together in one place and in context.. The data in this report is derived from the NY Fed's own consumer credit panel and drawn from anonymous Equifax credit data..
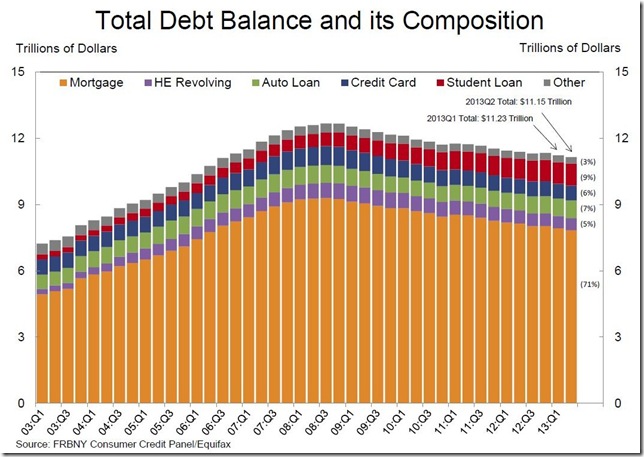
According to the NY Fed, outstanding consumer debt fell $78 billion from $11.23 trillion to $11.15 trillion at the end of the 2nd quarter, a decline of 0.7% from the 1st quarter, and 12.0% below the debt peak of $12.68 trillion in the third quarter of 2008. Mortgage balances fell by $91 billion, or 1.1%, to $7.84 trillion, and home equity lines of credit decreased by $12 billion, or 2.2%, to $540 billion, while the non-housing components of household debt increased 0.9%. Total credit card debt was up $8 billion to $668 billion, outstanding student loan debt increased $8 billion to $994 billion, and auto loan balances increased $20 billion to $814 billion, the largest quarterly increase in auto loans since 2006. These components are shown graphically in the bar graph below from page 5 of the report, which shows the components of total debt for each quarter since the beginning of 2003. The bar at the far right represents the 2nd quarter and shows mortgage debt in orange has continued to shrink and now represents 71% of household debt. Meanwhile home equity loans in purple accounted for 5% of 2nd quarter debt, auto loans in green accounted for 7%, credit card debt in blue accounted for 6%, and student loans in red have now risen to 9% of the total debt outstanding..(uncategorized debt in grey is 3% of the total). We should note that this report does not distinguish between mortgage debt that has been paid off and mortgage debt that has been extinguished through a foreclosure or a short sale...
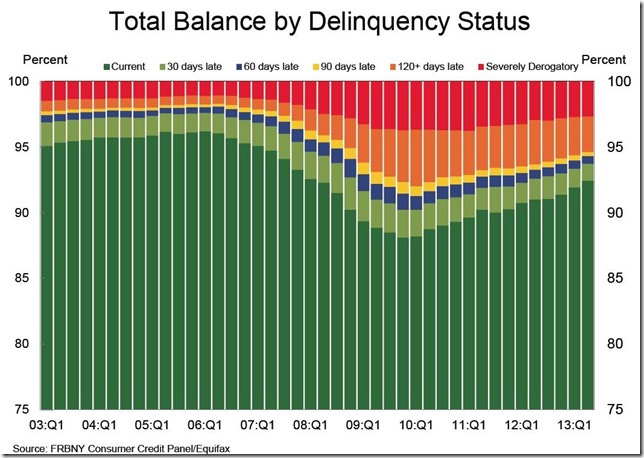
The next graph below, from page 10 of the report, shows the percentage of all that debt for each of those years that was either current or delinquent during the given quarter. In each bar the percentage of loans by dollar value that is current is represented by the dark green, while the percentage of debt that is more than 30 but less than 60 days delinquent is shown in green, while the percentage over 60 days overdue is shown in blue, over 90 days unpaid debt in yellow, and the percentage of debt over 120 days in arrears is shown in orange. The red in each column represents the percentage of debt in that quarter which was severely derogatory, which includes foreclosures, debt referred to a third party for collection, or debt charged off as bad debt. Roughly $845 billion of 2nd quarter debt was delinquent, with $635 billion of that seriously delinquent, or more than 90 days behind in payments. As of the end of June, 7.6% of all debt was in some stage of delinquency, compared to the 8.1% delinquency rate at the end of the first quarter.. The 90+ day delinquent balances of student loan debt that made this report newsworthy the past two quarters moderated, as seriously delinquent student debt fell from 11.2% of that outstanding in Q1 to 10.9% in the 2nd quarter. If we compare this graph to the mortgage delinquency and foreclosure graph from the MBA we saw last week, it's fairly clear that the delinquency status shown here over time aligns fairly closely with that of the mortgage debt for the corresponding quarters..
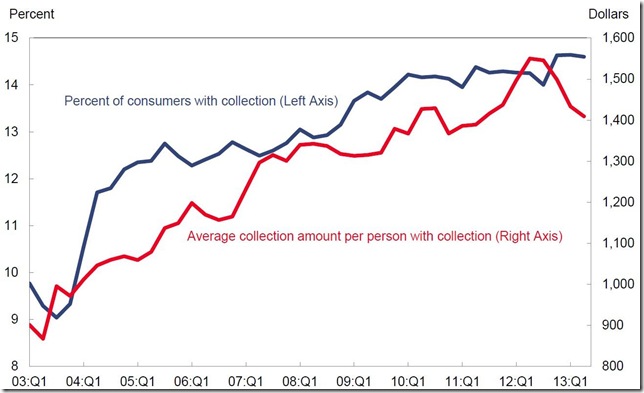
Next, the adjacent chart, from page 17 of the pdf report, shows the percentage of consumer loans that have been referred to a 3rd party for collection in blue, and the average size of such loans for each quarter since the first quarter of 2003 in red. This is surprising on two counts; first, that well over 14% of loans are now in the hands of a collection agency or lawyer, and second, that the average loan balance that is referred for collection is comparatively low, now near $1400. Much of this is said to be medical debt; we would have thought the average amounts collectors were going after would be higher…
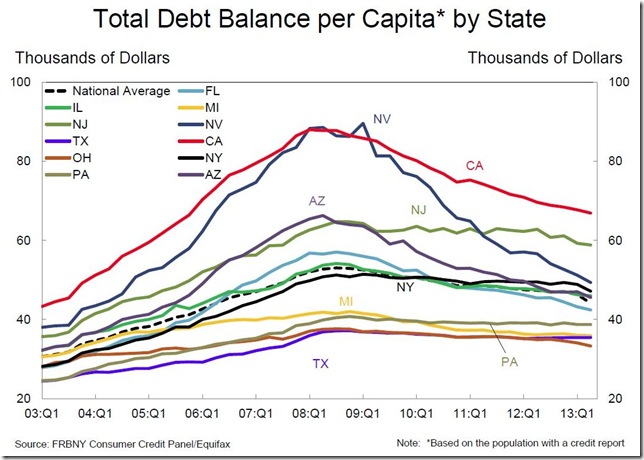
The 2nd half of the report (after page 18) is a series of charts for selected states; 12 states are included on each graph, and those chosen appear to be the 10 largest states plus Arizona and Nevada, the two states at the center of the housing bust and subsequent mortgage debt crisis.. Pages 21 and 22 have the equivalent of the two charts above broken down by state. The first state graph we'll include here below is from page 20 of the pdf report and it shows the total debt outstanding per capita for each of those 12 selected states. We can note that both California in red and Nevada in dark blue peaked near $90,000 per capita debt, and now both states, which have seen significant foreclosures and distressed home sales, are well off their peaks. However, not much has changed in New Jersey, another high debt but judicial state in green, where foreclosures are moving so slowly it would take over 40 years at the current pace to process them all. Also note that outstanding debt per capita in Ohio, Michigan, Pennsylvania, and Texas never got much over $40,000 per capita, and outstanding per capita debt hasn't fallen much for any of them during this so-called deleveraging period either.
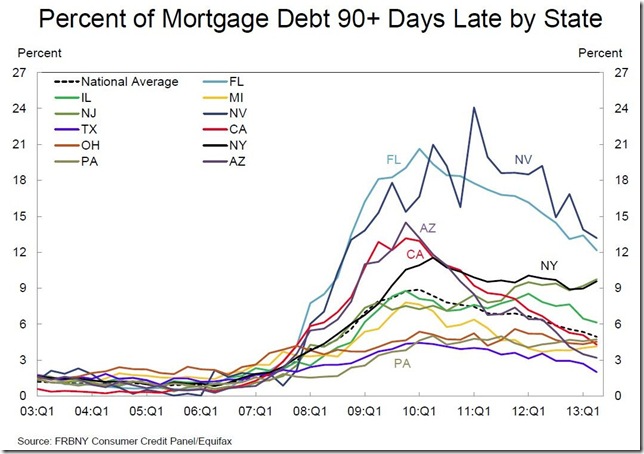
The next chart below, from page 24 of the report, shows the percentage of mortgage debt in each of our selected states that was 90 or more days delinquent in each quarter since 2003. Again, not surprising that both Nevada and Florida saw seriously delinquent mortgage debt peak at over 20% of all housing related debt outstanding in those states, nor that both are still showing more than 12% of the mortgage loan amounts outstanding not currently being paid back. Note that the percentage of seriously delinquent mortgage debt is increasing this year in both New York and New Jersey, and is now over 9% for both.. We saw last week that LPS showed that nearly half the states still have over 10% of their mortgages in some stage of delinquency in June, and that the MBA showed a seriously delinquency rate of 5.88% at the end of the 2nd quarter. The metric shown here is a bit different than those in the LPS and MBA mortgage delinquency data, in that they give the percentage of loans in trouble, whereas the chart below shows the percentage of aggregate mortgage debt in dollars that has been unpaid for 90 days or more..
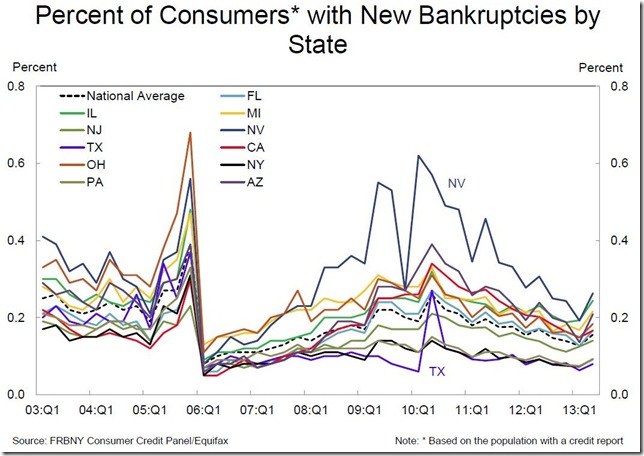
Lastly, we'll include this graph of the percentage of new bankruptcies by state, which comes from page 28 of the pdf report, and note that bankruptcies appear to have increased in every state graphed (and nationally, too, as per the national graph on page 16). The NY Fed makes no comment on this quarter’s uptick, but only notes that 380,000 consumers had a bankruptcy notation added to their credit reports in 2013 Q2, a 4.8% drop from the same quarter a year earlier. There may be a seasonal pattern in bankruptcies at work here, but the chart is a bit too noisy to accurately discern that.
(crossposted from Marketwatch 666)

Comments
subprime gets a new home?
Wow, subprime auto loans, awesome. Are they being packaged up as derivatives, sold in bulk?
The game continues, just a new version?
Great overview!