
The January 2013 Federal Reserve's Industrial Production & Capacity Utilization report shows a monthly decline of 0.1% in industrial production. January's decline would have been much worse if the weather hadn't turned cold. Utilities' output increased 3.5% for January as mining fell 1.0%. Manufacturing alone dropped -0.4% for the month. December was revised up to a 0.4% increase, buoyed by better manufacturing for the month. The G.17 industrial production statistical release is also known as output for factories and mines.
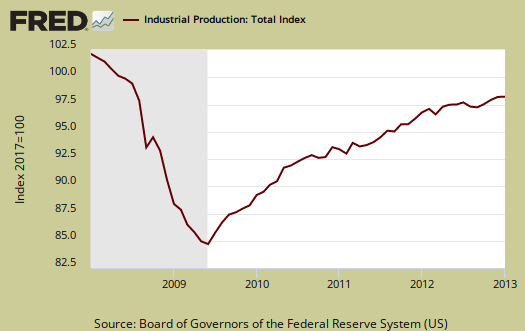
Total industrial production has increased 2.1% from January 2012 and is still down -1.4% from 2007 levels, going on past an incredible five years. Even worse, manufacturing alone is still -5.8% below it's December 2007 output level. Here are the major industry groups industrial production percentage changes from a year ago.
- Manufacturing: +1.7%
- Mining: +1.8%
- Utilities: +5.9%
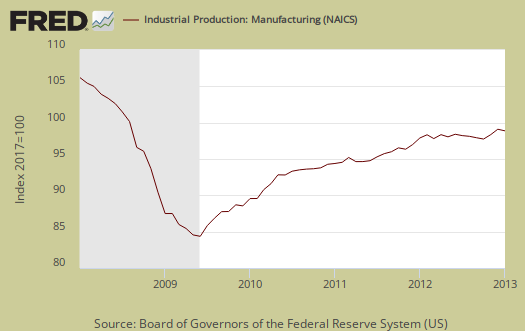
Manufacturing alone dropped -0.4% for January, but was revised upward for for December to 1.1%. November was also revised upward for manufacturing production to 1.7%. This gives a great Q4 annualized percentage change of 1.9% instead of the paltry 0.2% previously estimated. We see another revision which should result in Q4 GDP being better news. Below is a graph of just the manufacturing portion of industrial production.
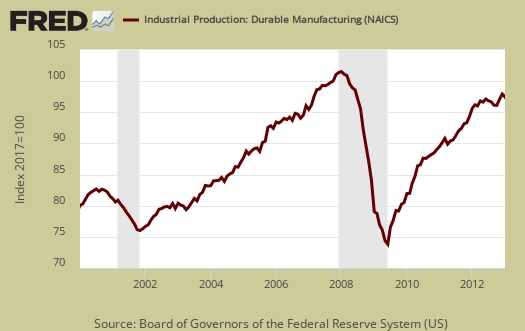
January saw things not so hot in manufacturing. Durable goods declined by -0.5% but the real bad news is autos & parts. Motor vehicles & parts dropped -3.2% in a month as did primary metals with a -2.6% decline. Durable goods output dropped across the board, it wasn't just these two categories.
Nondurable goods manufacturing also dropped, -0.3%, but rose 1.1% in December. Chemicals topped the list with a -1.0% monthly decline. Below is nondurable goods by industry.

There are two reporting methodologies in the industrial production statistical release, market groups and industry groups. Market groups is output bundled together by market categories, such as business equipment or consumer goods. Industrial output is by NAICS codes and is for all manufacturing, or all types of durable goods manufacturing*. Below is the Fed's description of Market groups from the report and their monthly percent changes.
The production of consumer goods declined 0.2 percent in January following an increase of 0.4 percent in December. In January, the index for consumer durables decreased 2.0 percent, but the index for consumer nondurables rose 0.4 percent. Among durable consumer goods categories, the production of automotive products dropped 3.9 percent and the output of home electronics fell 1.3 percent; these losses were partly offset by an increase of 2.0 percent for appliances, furniture, and carpeting and a small gain for miscellaneous goods. A weather-related jump of 3.1 percent in the output of consumer energy products boosted the index for consumer nondurables; the output of non-energy goods declined 0.5 percent, with decreases in all of its major components except clothing.
The output of business equipment edged up 0.1 percent in January and was 6.9 percent above its year-earlier level. The small gain in January was supported by an increase of 0.4 percent in the industrial and other equipment category; the indexes for transit equipment and information processing equipment each fell 0.3 percent. All three of the major components of business equipment have moved up over the past 12 months, but the advance of 16.0 percent for transit equipment substantially exceeded the gains of around 4 percent for the other categories.
The production of defense and space equipment increased 0.4 percent in January following a decrease of 0.5 percent in December; the index was up 4.2 percent over the past 12 months.
Among nonindustrial supplies, the output of construction supplies declined 0.1 percent in January following gains of 1.0 percent in December and 2.5 percent in November. In January, the output of construction supplies was 2.1 percent above its level of a year earlier. The production of business supplies rose 0.6 percent in January after having decreased 0.2 percent in December. In January, the indexes for both categories of nonindustrial supplies remained well below their pre-recession peaks.
The production of materials to be processed further in the industrial sector moved down 0.2 percent in January after having risen 0.5 percent in December. In January, the output of durable materials slipped 0.2 percent; the indexes for equipment parts and consumer parts both increased slightly, but the index for other durable materials fell 0.6 percent. The production of nondurable materials declined 0.7 percent; a gain of 1.8 percent in the output of textiles was outweighed by losses in the indexes for paper and chemicals. The output of energy materials was unchanged.
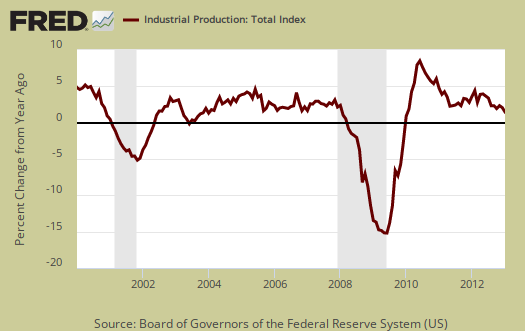
Below is graph of overall industrial production's percent change from a year ago. What an incredible flat line this is overall.
Capacity utilization, or of raw capacity, how much is being used, for total industry is 79.1%, now 1.1 percentage points below the average from 1972 to 2012, 80.2%. Capacity utilization has increased 0.4 percentage points from a year ago. Manufacturing capacity utilization, 77.6%, is now 0.1 percentage points above the 77.5% level a year ago. Can you say flat line for a year?
Capacity utilization for durable goods has improved and is now 76.7%, which is only 0.4 percentage points below the long run average. Nondurable goods, on the other hand, is still 3.0 percentage points below it's long run average and stands at 77.9%.
Utility capacity utilization has increased 2.6 percentage points from a year ago to 74.8%. Mining has decreased 0.4 percentage points, to 90.8% from a year ago. Capacity utilization is how much can we make vs. how much are we currently using, of what capacity is available now. Capacity utilization is industrial production divided by raw capacity.

Capacity growth is raw capacity and not to be confused what what is being utilized. Instead, this is the actual growth or potential to produce. Capacity is the overall level of plants, production facilities, and ability to make stuff, that we currently have in the United States. Think about a new factory being built, or a factory shut down and it's machinery sold at auction and shipped to China. This is capacity. Capacity growth overall has increased only 1.6 percentage points from January 2012. Below is the capacity growth increase from a year ago of the subcategories which make up industrial production.
- Manufacturing: +1.6%
- Mining: +2.3%
- Utilities: +2.3%
According to the report for 2012, manufacturing uses 77.2% of capacity, with durables about 39.8%. Utilities use 10.2% and mining 12.7% in 2012 (rounded) to give a ratio of manufacturing vs. mining and utilities in terms of capacity. Below is the Manufacturing capacity utilization graph, normalized to 2007 raw capacity levels, going back to the 1990's. Too often the focus is on the monthly percent change, so it's important to compare capacity utilization to pre-recession levels and also when the economy was more humming.

What's interesting is the Fed's note on annual revisions of capacity, to be incorporated in the March report. Look at the difference and is this wishful thinking on the 2013 projections?
The data in this release include preliminary estimates of industrial capacity for 2013. Measured fourth quarter to fourth quarter, total industrial capacity is projected to rise 2.1 percent this year after having increased 1.5 percent in 2012. Manufacturing capacity is also estimated to advance 2.1 percent in 2013 after having gained 1.4 percent in 2012. Mining capacity is estimated to rise 3.1 percent in 2013 after having moved up 2.2 percent in 2012, and capacity at electric and natural gas utilities is projected to expand 1.2 percent this year after having increased 2.4 percent last year.
Here are our previous overviews, only graphs revised. The Federal Reserve releases detailed tables for more data, metrics not mentioned in this overview. If you are baffled by what crude, finished mean from the G.17 report, read these stages of production definitions. Stages of production have implications for exports and imports. Finishing industrial production implies goods for final sale and thus what kind of output one will see for the month. From the report:
Capacity utilization rates in January at industries grouped by stage of process were as follows: At the crude stage, utilization fell 1.1 percentage points to 88.5 percent, a rate 2.2 percentage points above its long-run average; at the primary and semifinished stages, utilization increased 0.4 percentage point to 76.4 percent, a rate 4.6 percentage points below its long-run average; and at the finished stage, utilization decreased 0.6 percentage point to 77.8 percent, a rate 0.6 percentage point above its long-run average.
*From the Federal Reserve definition details:
Market groups consist of products and materials. Total products are the aggregate of final products, such as consumer goods and equipment, and nonindustrial supplies (which are inputs to nonindustrial sectors). Materials are inputs in the manufacture of products. Major industry groups include three-digit NAICS industries and aggregates of these industries-for example, durable and nondurable manufacturing, mining, and utilities./blockquote>
Recent comments