
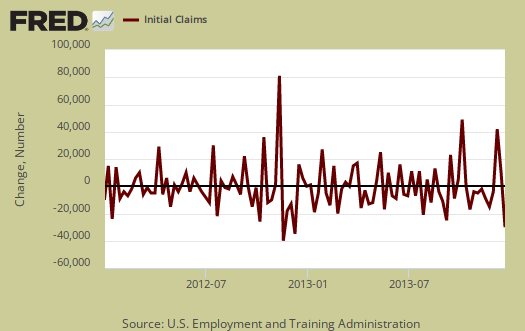
The DOL reported people filing for initial unemployment insurance benefits in the week ending on December 21th, 2013 was 338,000, a 42,000 decrease from the previous week of 373,000. Many headlines proclaim this is the largest drop since November 2012, yet what the press does not mention is that very time period in 2012 also had wild, whacky statistical swings. The real problem with these figures is they are really out of whack and way out of the norm, even for the holidays. Graphed below is the number change of initial claims and we can see wild swings from week to week.
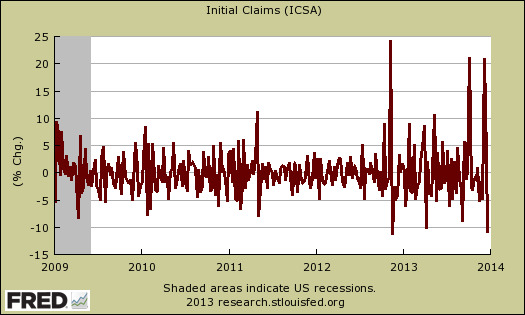
Many in the press claim the holidays, from Thanksgiving to the New Year are the reason for the wild swings. Yet the below graph shows the percentage change in initial claims from week to week in order to show the variance. Notice how the percentage change has increased dramatically on a weekly basis in 2013 One has to go back to September 2005 to find an almost 30% weekly percentage change like these. Yet for 2013, there are multiple above 20% percentage changes. One can be explained by California back processing claims and having delays. Yet two weeks ago there was a 21% increase in initial claims. If anything this week's -11.1% change implies an timing issue and a correction for the sudden rise two weeks ago. In other words, this week's figure is not to be believed. Additionally with wild weekly swings like this, by percentages which takes into account the larger numbers of filers during the great recession, we cannot say weekly drops are due to real changes in filings. We can say something funky is going on with the data collection and reporting methods. It is also possible that the wild weather is bringing havoc to initial claims.
The bottom line is initial claims is not to be believed and relying on a weekly statistic to determine which direction the labor market is going is a fool's errand. At minimum one should look at the 4 week average, but we believe one should take the long term trend line of the 4 week average to see what's really going on.
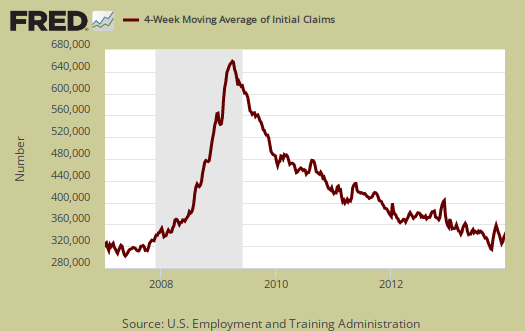
The four week moving average increased by 4,250 to 348,000. In the below graph we see the four week moving average is still at pre-recession 2007 levels. We see a slope decline but not a fast moving one. The below graph has a fat tail, which implies the job market still is pretty horrific.
Below is the mathematical log scaling of initial weekly unemployment claims. A log scale helps remove some statistical noise, it's kind of an averaging and gives a better sense of a pattern. As we can see, we have a step rise during the height of the recession, but then a leveling, then a very slow decline, or fat tail. That fat tail has taken over six years to return to early recession levels, so the time it has taken to drop is also a concern. There are a lot of people out there who are not counted in labor force statistics who need a job.
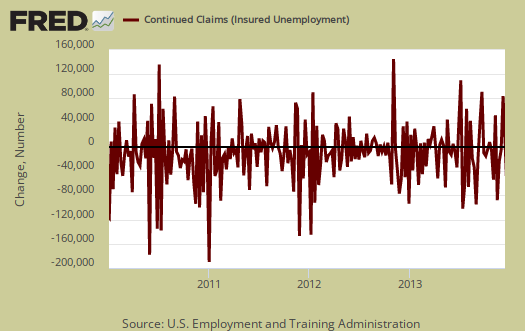
Continuing claims are quoted in the press as having a sudden increase. The reality is continuing claims also has variance and this week's increase was not out of line or unusual. One should also notice the insured unemployment rate is 2.2%, a far cry from the official unemployment rate and this shows just how large the percentages are of unemployed who cannot obtain insurance benefits. The below graph is the number change from week to week on continuing claims and it shows there are large swings in this statistic.

The advance number for seasonally adjusted insured unemployment during the week ending December 14 was 2,923,000, an increase of 46,000 from the preceding week's revised level of 2,877,000. The 4-week moving average was 2,836,750, an increase of 39,500 from the preceding week's revised average of 2,797,250.
In the week ending on December 7th, the not seasonally adjusted, the official number of people obtaining some sort of unemployment insurance benefit was 4,279,284 with 1,333,332 people receiving 2008 EUC, which was not extended and thus ending in two days. That is a lot of people who just got their benefits cut. There were 11 million official unemployed in November. The number of unemployed has remained almost static for some time.
As much as people wish it so, most government data is not complete and not real time. We have repeatedly warned, ad nauseum, do not bank on the initial claims number reported in the press release for that week. Initial claims for unemployment benefits is a weekly statistic and that implies a very short time window for data collection, it is always revised the next week, almost always upward. One can have unusual events which throw off the seasonal adjustment algorithm. One can have missed timing of events that can also throw a monkey wrench in one week's worth of data. As we pointed out in our weirdness in initial unemployment claims article, states might not report their quarterly adjustments for emergency unemployment benefits and we had the infamous fiscal cliff push past the final hour, which included extending those unemployment benefits for the long term unemployed last year. This article went into more analysis, complete with annual moving averages and graphs.
Recent comments