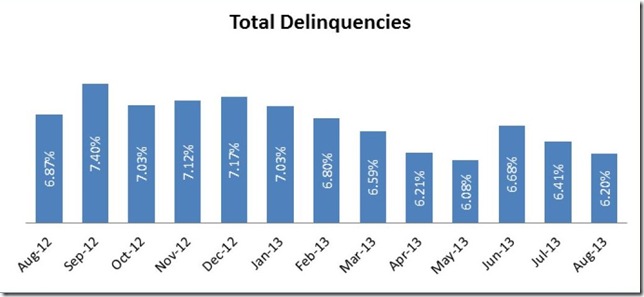
 One report out this week which we regularly cover for a monthly look at the ongoing mortgage crisis is the August Mortgage Monitor (pdf) released by Lender Processing Services (LPS). LPS reported that 1,340,995 loans, or 2.66% of active first lien mortgages, were in the foreclosure process in August, down from 1,406,000, or 2.82% in July and down from 4.04% of all mortgages a year earlier. As you may recall, these are home mortgages where foreclosure proceedings have been started, but the homes had not yet been seized by the bank. In addition to homes in foreclosure, LPS also reports the national delinquent mortgage rates. In August, LPS found that 3,124,000 home loans, or 6.20% of mortgages outstanding, were at least one payment (30 days) behind; when combined with those in foreclosure, that means 4,465,000 home mortgages, or more than one in eleven, were either delinquent or in foreclosure at the end of August. Of those delinquent, 1,288,000 were seriously delinquent, or more than 90 days late on their housepayments, and 1,836,000 were more than 30 but less than 90 days delinquent at the end of the month. The bar graph to the right, from the August summary on page 19 of the mortgage monitor (pdf) shows the percentage of homes that were delinquent each month for the past 13 months. You can see that May was the low water mark this year at 6.08%, which followed by the large jump in delinquencies in June to 6.68%, driven by an 18.3% spike in new delinquencies which LPS called "seasonal". Also evident it the large spike in delinquencies in September of last year, coinciding with the release of the iphone5. Since there was a similar rush to buy the new iphone5c and well as record sales for Grand Theft Auto V in September, we would not be surprised to see another spike of 10% or more in mortgage delinquencies when LPS releases the September mortgage monitor a month from now.
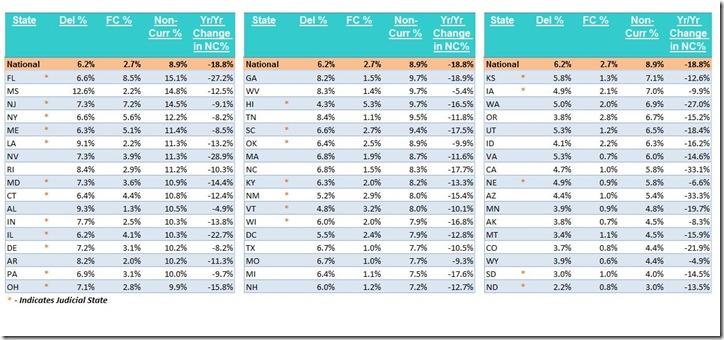
Next we'll include this month's table showing the percentages of non-current (NC) mortgages for each state (from page 20 of the pdf); shown for each state are the percentage of home loans that are delinquent (Del%), the percentage of mortgages that are in foreclosure (FC%), the total mortgages that aren't current with their payments (NonCurr%) and the year over year change in the number of non-current mortgages. Also note that states that have a judicial foreclosure process, where the bank must prove their right to foreclose on a homeowner in court, are marked by a red asterisk. Although the percentage of non-current mortgages in Florida is down 27.2% from last year's 20.7% level, they still lead the nation in the percentage of non-current mortgages at 15.1% and in the percentage of mortgages in foreclosure at 8.5%, while all the other states that still have more than 4% of their mortgaged homes in foreclosure are also all judicial states; New Jersey with 7.2%, New York with 5.6%, Hawaii with 5.3%, Maine with 5.1%, Connecticut with 4.4%, and Illinois with 4.1%. Also note that the non-judicial state of Mississippi, the state with the 2nd most non-current mortgage, is something of an outlier here, as they've has a chronic delinquency problem, with 12.6% of homeowners late on their housepayments, while they're still below the national average of homes in foreclose at 2.2%...
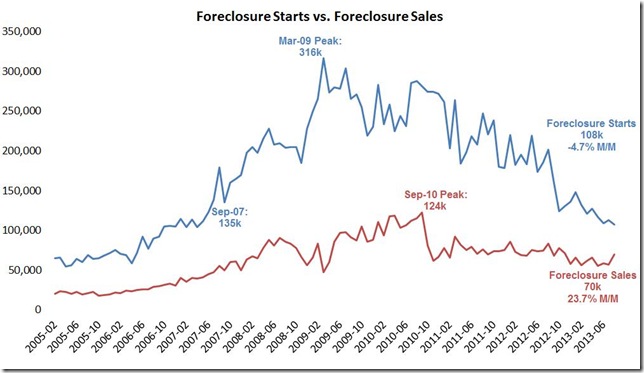
The next graph that we'll look at from the mortgage monitor (page 15) shows the historical tracks of monthly foreclosure starts in blue and foreclosure sales in red since the beginning of 2005. Foreclosure starts are those mortgages that had the first foreclosure action taken against them in that month, while foreclosure sales are those mortgages that have proceeded through the last legal step in that month, which is typically an auction that transfers the home into the bank REO (real estate owned) portfolio. We can see foreclosure starts in blue beginning to rise from just over 50,000 a month in 2005 to 135,000 in September 2007 to where it peaks at 316,000 foreclosure starts in March of 2009, after which the number of foreclosure starts tended to stay well over 175,000 a month until early this year, falling to a post housing bust low of 108,000 in August, down 4.7% from July's 112,850. Completed foreclosures in red, however, have trended much lower throughout the recession; they rose from a pre-crisis 25,000 a month to an average of near 100,000 a month throughout 2009 to peak at 124,000 in September of 2010, then fell back to below well below 100,000 a month after the robosigning foreclosure fraud scandal hit.. And although the foreclosure sales line has been trending down, averaging 61,000 a month in 2013 compared to 73,000 a month in 2012, they have remained above 50,000 a month until August, when completed foreclosures jumped 23.7% over July's level to 70,000....
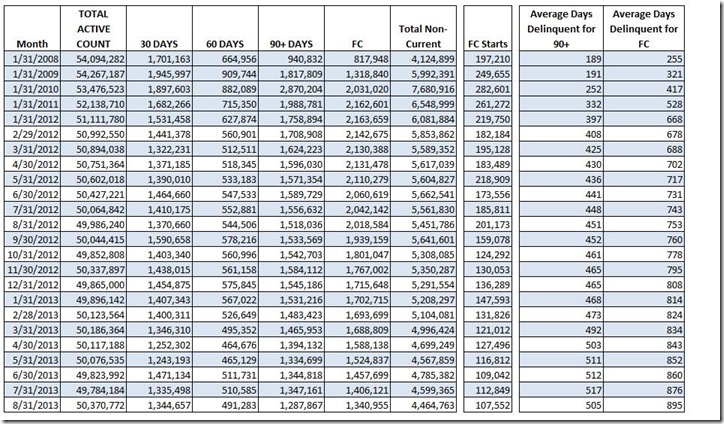
What you should also notice from this graph is that foreclosure starts have been running well ahead of foreclosure completions, by as many as 200,000 a month from 2009 through 2011, and more than normal (defined by the gap of less than 50,000 a month in 2005) throughout the crisis. So what happened to all those homeowners who had foreclosure actions taken against them early in the crisis? While some who had foreclosures started against them may have cured their mortgage by making up the missing payments, negotiated a short sale or otherwise worked out a mortgage modification, the lions share of them appear to still be in foreclosure limbo.. In the table below (from page 20) we have the total loan counts of delinquent mortgages by days delinquent, the number in foreclosure (FC) and the foreclosure starts for each January since 2008 and each month since 01/2012. However, what we want to look at it is the last column, which lists the "average days delinquent for foreclosure" for each month listed. You can see that by the beginning of 2012 those in foreclosure had been delinquent for an average of 668 days, and some obviously much longer, since a number of those in foreclosure probably first has theirs initiated in 2011. By June of last year, those in foreclosure had been delinquent on their mortgages for an average of over 2 years, and that duration continued to lengthen to 876 days by July of this year and increase by another 19 days with this August report. When an average length in foreclosure jumps as much as 19 days over a month even as new foreclosures are started, it's obvious that most of those who've been in foreclosure for years aren't going anywhere...
We would also note on the above table the second column from the right, which similarly shows the average of how may days those who've been delinquent for more than 90 days have remained in their homes without being foreclosed on. In a reversal of the trend, the average length of time that those seriously delinquent have remained in their homes without being foreclosed on has fallen to 505 days, down from 517 days in July and at a 4 month low. Since foreclosure starts are at a new crisis low, we'd have to guess many of those who left that long term delinquency status in August either exited via a short sale or a mortgage modification of some kind. Nonetheless, of the 1,347,000 plus homeowners who were seriously delinquent in July, a significant portion of them likely lived in their homes without making payments for 2 years or more before making that exit...
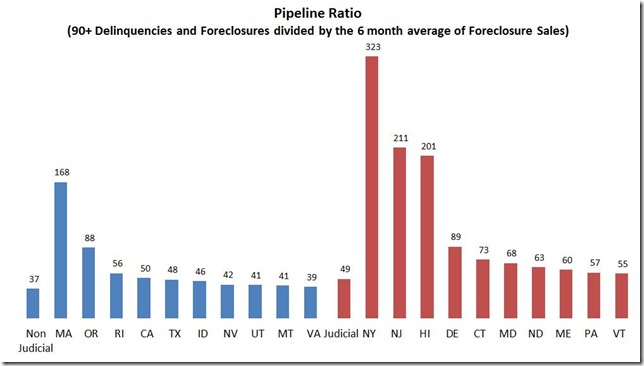
Returning to the predicament where we've seen that the average homeowner who is in the foreclosure process has been in that situation for nearly 900 days, we'll now look at a bar graph below (from page 17) that shows the pipeline ratios for 10 select judicial states in red and 10 non-judicial states in blue. The foreclosure "pipeline' is the duration that a mortgage spends in the foreclosure process between the foreclosure start and the foreclosure sale, which completes the process. In computing the pipeline ratio, the industry takes the sum of all those mortgages that are seriously delinquent or in foreclosure in a given state and divides it by the average number of completed foreclosures per month over the last 6 months. What this number gives us then is the number of months that it would take for all those in the foreclosure inventory and the pre-foreclosure inventory to clear at the current rate foreclosures are being completed in that state. Thus, for the judicial states, where a foreclosure must go through the courts, at the rate at which foreclosures are being processed nationally, it would take more than 4 years - 49 months to be exact, for all those seriously delinquent and in foreclosure homes to be adjudicated. But as you see by the red bars; the pipeline ratio in some states is much longer; in New York at the rate foreclosures are being processed, it would take 323 months, yes, nearly 27 years to clear the backlog; New Jersey at 211 months, or 17 and a half years, and Hawaii, at 201 months, aren't much faster. But overall the foreclosure pipeline in these judicial states has been dropping, from an average of 118 months in early 2011 too the current 49 months now. However, the non-judicial states, where foreclosures have always been faster, have not seen much change, because several of them have passed laws protecting homeowners and levying fines for foreclosure fraud. So we now see a non-judicial state such as Massachusetts with a pipeline ratio of 168 months, up 136% from the second quarter a year ago, meaning it would now take 14 years to clear that state's foreclosure backlog. The ostensible reason? Last year Massachusetts passed a law giving judges the power to decide whether a bank can foreclose or must modify the mortgage. Similarly, California, a non judicial state where foreclosures had been being executed rapidly, has now seen a 68% increase in the foreclosure pipeline with the passage of a homeowners Bill of Rights, written to curtail lender abuses. Likewise, Nevada passed a law in 2011 making it a felony if a mortgage servicer made fraudulent representations concerning a title, and imposed fines up to $5,000 for falsifying documents, which temporarily brought foreclosures in that state to a standstill. Although foreclosure proceedings in Nevada have since resumed, they're at a slower pace, and hence the foreclosure pipeline for that state at 42 months is still 56% higher than it was before the law was passed...
(crossposted from MarketWatch 666)

Comments
I'm wondering
what is going to happen with all of these people who are living, rent free in houses to be foreclosed upon lose their housing. Rents are increasing and in many areas of the country are really unaffordable, some areas unaffordable even with 6 figure incomes.
where do foreclosed people go
where do foreclosed people go? not sure anyone knows, because there was an issue with the foreclosure fraud settlement wherein thousands of those who had a small check coming could not be found..
all these families not paying on their mortgages (2 and a half million if you add 90 day delinquent to those stuck in foreclosure) also amounts to a de facto boost to disposable personal income....there was quite a debate in the blogosphere 2, 3 years ago if that was a major factor in the unexpected jumps in retail sales being seen at the time...with unemployment countervailing, no one could really quantify it...
rjs