
In October, New Residential Single Family Home Sales increased +1.3%, or 307,000 annualized sales. But watch for it, this report has a ±19.7% margin of error. This is a +8.9% increase from a year ago.
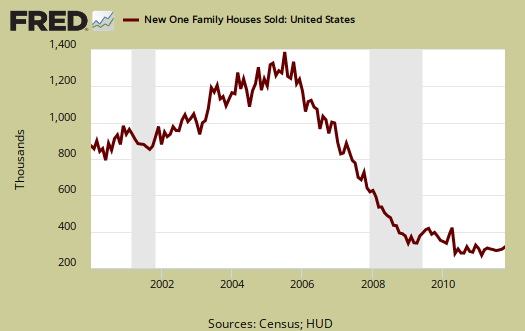
These numbers are seasonally adjusted, but also with large error margins, where the margin of error is outside the actual reported percentages. Weather can influence sales. For example, the error window, (90% deviation), for the change from one year ago is ±17.2%.
The supply of new homes is little changed, now at 6.3 months, at current sales rates, of inventory, or 162,000 and a -19% decrease in supply from October 2010.

Both the median price and average new home price dropped from last month. October's average price was $242,300, down from September's $248,400. The average home price is down to October 2003 levels.

In October, the median price was $212,300, whereas September's median price was $213,300. The graph below are the monthly median home prices.
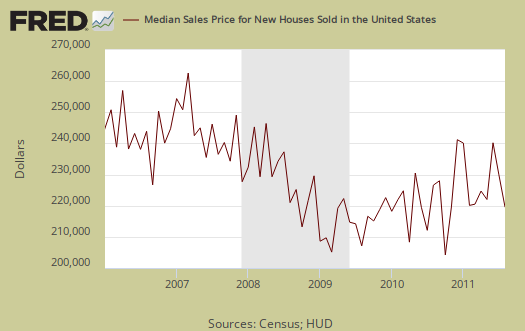
If one looks at median and average sales prices, they are still way out of alignment with wages and salaries, which are flat for over a decade, even with record low mortgage rates.
The median time new homes were for sale was 7.4 months, a low not seen since early 2008.

The variance in monthly data is so large, all one can say is new home sales are rolling around in a bottom and not much is going to happen with residential real estate until the unemployment rate returns to 5% or so and demand in the economy picks up.
Calculated Risk compares new home sales to recessionary periods and goes back to 1963 in data comparisons.
Recent comments