
Pending Home Sales rose in November by 1.7%, annualized according to the National Association of Realtors. This is highest level since April 2010 to an index level of 106.4 and a 9.8% increase from a year ago. October pending home sales was revised down to 5.0% increase from September.
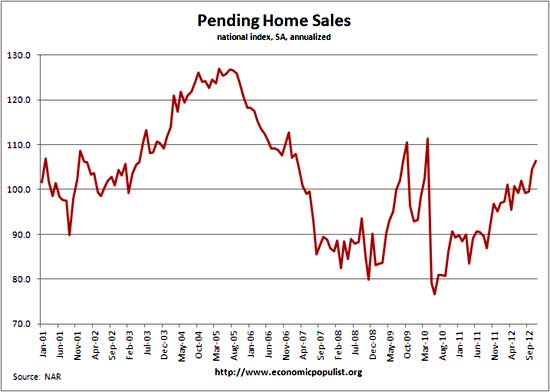
The above graph shows pending home sales are really around 2003 levels, ignoring the housing bubble itself and the first time home buyer tax credits of 2009. The deadline for using the first time home buyer tax credits was April 2010, which resulted in a 111.3 pending home sales index. Yes folks, tax credits do work.
The PHSI are contracts which have not yet closed and why pending home sales are considered a future housing indicator. The PHSI represents future actual sales, about 45 to 60 days from signing. From the NAR:
NAR's Pending Home Sales Index (PHSI) is released during the first week of each month. It is designed to be a leading indicator of housing activity.
The index measures housing contract activity. It is based on signed real estate contracts for existing single-family homes, condos and co-ops. A signed contract is not counted as a sale until the transaction closes. Modeling for the PHSI looks at the monthly relationship between existing-home sale contracts and transaction closings over the last four years.
Here are the regional pending home sales from the report:
The Northeast rose 5.2 percent to 83.3 in November and is 15.2 percent above a year ago. In the Midwest the index edged up 0.1 percent to 103.8 in November and is 15.2 percent above November 2011. Pending home sales in the South were unchanged at an index of 117.2 in November and are 13.9 percent higher than a year ago. In the West the index rose 4.2 percent in November to 110.1, but is 3.2 percent below November 2011.
It seems the NAR future pending home sales forecasts have come off their smokin' crack high. Earlier in the year the NAR claimed housing starts will increase 50% by 2014. We have these more realistic predictions. Seems finally people are realizing the housing bubble is not going to return, nor should it.
The upward momentum means existing-home sales should rise 8 to 9 percent in 2013 to approximately 5.1 million, following a 10 percent gain expected for all of 2012. The median existing-home price is projected to rise just over 4 percent in 2013, after rising more than 7 percent in 2012.
Foreclosure activity for November shows foreclosure starts are at a 71 month low and have declined 28% from a year ago. That said, bank repossessions increased on an annual basis for the first time since October 2010.
- U.S. foreclosure starts were down 13 percent from the previous month and down 28 percent from a year ago to the lowest level since December 2006 — a 71-month low.
- U.S. bank repossessions (REO) increased 11 percent from the previous month and were up 5 percent from November 2011, a nine-month high and the first year-over-year increase in REOs since October 2010.
- Despite the national decrease in foreclosure activity — driven largely by big year-over-year drops in California, Georgia, Michigan, Texas and Arizona — foreclosure activity increased from a year ago in 23 states and the District of Columbia. Nine states posted 12-month highs in foreclosure activity in November, including Florida, New Jersey, New York, Ohio and South Carolina.
- Florida posted the nation’s highest state foreclosure rate for the third month in a row, with one in every 304 housing units with a foreclosure filing in November, followed by Nevada, Illinois, California and South Carolina.
- Seven of the top 10 highest metro foreclosure rates nationwide were in Florida, led by Palm Bay-Melbourne-Titusville. The other three metros in the top 10 were in California.
- Among the five lenders involved in the National Mortgage Settlement — Bank of America, Wells Fargo, JPMorgan Chase, Citi and Ally/GMAC — non-judicial pre-foreclosure activity (NOD, NTS) decreased 41 percent in November compared to a year ago, led by Bank of America with a 63 percent decrease and Citi with a 40 percent decrease. Meanwhile judicial pre-foreclosure activity (LIS, NFS) for the five lenders combined increased 26 percent from a year ago, led by Chase with a 114 percent increase and Wells Fargo with a 37 percent increase.
Here are our past pending home sales overviews, unrevised.
Recent comments