
We'll start by looking at the Advance Monthly Retail Sales Report for December from the Census Bureau, which estimated that our total seasonally adjusted retail and food services sales were at $431.9 billion, which was 0.2 percent (±0.5%)* higher than November sales. Before the seasonal adjustment, December's sales were estimated at $488.7 billion, up 13.2% from November's $431.8 billion, about the increase we would expect for December. The adjusted increase in November sales was revised from a +0.7 percent (±0.5%) increase from October to a 0.4 percent (±0.2%) increase, so on net this report reflects a 0.1% contraction from what was previously reported. Also note the range of accuracy for December of ±0.5% and the Census asterisk, which advises us that they have insufficient data to determine whether sales actually rose or not in December, but that they're 90% confident the change in sales from November to December was between a decrease of 0.3% and an increase of 0.7%, and like the November report, this advance estimate will likely be revised when a larger sample of retail establishment sales are included in the next estimate. Despite the high degree of uncertainty in the data, this is a widely watched indicator, and ultimately will be used to generate real goods consumption for the first estimate of the 4th quarter GDP, so we'll play along and look at these estimates as if they were exact.
First, we’ll include below a picture of the table of monthly sales percentage changes by business type from the Census pdf. There are essentially three double columns in that table, and we'll reference them all today. The first double column gives us the percentage change in sales from November to December in the first sub-column, and then the year over year percentage change since last December in the 2nd column. The second double column set below gives us the revision of November's advance estimates (now "preliminary") as of this report, with the October to November percentage change under "October 2013 revised" and the November to November percentage change as revised in the 2nd column of the pair (our picture of what those November percentages looked like before this revision is here). The third pair of columns shows the percentage change of the last 3 months - October, November and December sales - from the preceding three months (July through September) for each business type listed. This is effectively the percentage change in retail sales from the 3rd quarter to the 4th quarter overall. And finally, the last column shows the year over year percentage change in retail sales from the 4th quarter of last year (Oct 2012 to Dec 2012) to the 4th quarter of this year…
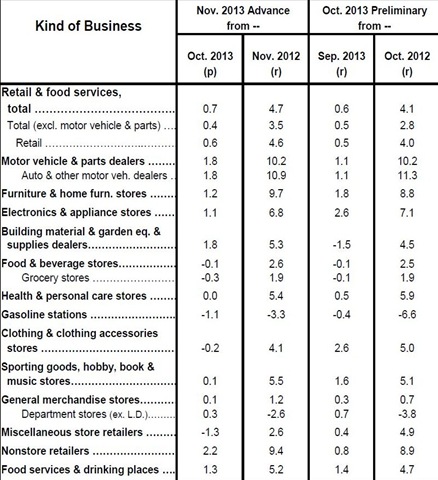

We'll be starting by reviewing the current month over month changes, as shown in the first column above. As has been the case in the two previous months, the change in vehicle sales were a major factor in the overall December change. The seasonally adjusted sales at motor vehicle and parts dealers were at $81,690 million, down 1.8% from November sales of 83,229 million. Without the fall in automotive sales, all other retail sales were up a respectable 0.7%, led by a 2.0% increase to $55,580 million at food and beverage stores; there must have been more holiday partying than normal. Sales at clothing stores were up 1.8%, from $21,180 million to $21,562 million, while gasoline station sales rose 1.6% to $45,327 million, with their year over year sales turning positive at up 0.6%. Non-store or online retailers also had a sizable December sales increase, as their sales rose 1.4% from $38,613 million in November to $39,141 million in December. Several retail sectors saw sales fall; seasonally adjusted sales at electronics and appliance stores fell 2.5%, from $8,578 million in November to $8,364 million in December; department store sales, not including leased departments, were down 0.7% to $14,453 million, although the entire general merchandise group rose 0.1% to $55,384 million. Sales at specialty shops, such as sporting goods, book and music stores, also fell 0.6%, from $7,812 million to $7,766 million, while sales at furniture stores fell 0.4% to $8,703 million...and sales at building material and garden supply stores also fell 0.4%, from $25,880 to $25,780. Understand that these are the seasonally adjusted sales, meaning sales rose or fell by that percentage over a normal December; ie, building material sales as reported were down 6.7% to $22,988, as you'd expect for a colder month, while electronics sales rose 24.2%, as you would expect before the holidays. What the seasonally adjusted change tells us is that building materials normally only fall 6.3% in December, while electronics sales were expected to rise 26.7%...
The pie graph below, which comes from from Robert Oak’s post on this report here at the economic populist, puts the sales of each of these business types in this report in perspective. Clearly, motor vehicles sales at 19% have the largest impact on the report. But note there are two large wedges that relate to food sales; grocery stores at 13% and restaurants and bars at 11% of sales, so almost a quarter of retail sales is food and drink. And also note that the big box stores still command a significant portion of sales at 13%, while sales at specialty stores (ie books, sporting goods), electronic and appliance stores, and furniture stores, at 2% of sales each, rarely change enough in one month to impact the overall report.

As we mentioned, there were major revisions to November sales as well, as we originally reported they increased by 0.7% only to find the increase has been revised to a 0.4% gain. Since the change in seasonally adjusted vehicle and parts sales was unrevised as an 1.8% increase, the retail sales change ex-autos was revised down from a 0.4% increase to just a 0.1% sales gain. Major changes from what we reported last month include sales at electronic and appliance stores, which were originally reported to have shown a 1.1% increase in November, and which have now been revised to show a 2.1% decrease. That, combined with what was apparently a good December last year, has turned year over year sales for electronic and appliance stores negative; in November, they had been showing a 6.8% year over year sales increase, while they’re now showing a now showing a 1.4% annual decrease from December 2012. Sales at furniture stores, which were originally reported up 1.2% over October, are now seen to have fallen 0.2%. Building material and garden supply stores, which were originally thought to have seen sales increase by 1.8%, have now seen their November sales gain cut to 0.4%. In addition, November sales at gasoline stations have been revised to show a 1.5% decrease from the 1.1% drop first reported, the sales decrease at clothing stores was revised from 0.2% to 0.5%, drug store sales fell 0.3% instead of being unchanged, and non-store (online) sales were reported up 2.2% and they're now seen as having risen only 1.6%. However, sales at sporting goods, hobby book and music stores, which were first reported to have increased only 0.1%, have been revised to show November sales 1.1% over October's, and miscellaneous store retailers, whose sales were first reported to have dropped 1.3%, have been revised to show a sales increase of 0.8% in November..
It’s also apparent from the new sales totals of the past three months that there have been notable downward revisions to October retail sales as well, which had been revised to a preliminary $429.4 billion with the November report; they are now shown to be just $429.0 billion, which means that the percentage increases for both November and December were off a lower base. As of that November report, we were led to believe that retail sales had risen 0.6% in October and 0.7% in November, which led us to believe that we’d see a decent 4th quarter boost to GDP from personal consumption expenditures. However, as we can now see from the third column of the initial table that we included above, the nominal growth in total sales for all three months over the third quarter is now just 1.0%, which doesn't even match the growth we previously thought we had out of just two months. Of course, to determine the effect of this weaker report on GDP, sales of goods for the 4th quarter GDP will need to be adjusted for inflation. Since the seasonally adjusted December Consumer Price Index for for All Urban Consumers (CPI-U) was also released this week, we can get a fair approximation of real goods consumption by arithmetically adjusting retail sales with the goods components of the consumer price index..
So next we’ll take a stab at adjusting retail sales over the entire 4th quarter for inflation over that same time span. We want to do that because we want to estimate the impact of personal consumption expenditures (PCE) on 4th quarter GDP. It's important to understand that GDP is not a dollar measure, although it is usually quoted in dollars; it’s a measure of the growth rate of our national product in UNITS of goods and services produced. Every dollar denominated component of GDP is adjusted with an inflation gauge in order to arrive at the quarter over quarter change in units of production. In the case of goods sold at retail, the BEA computes a PCE price index for goods to do this, which is quite a complex calculation. To simply our calculation, we’ll use the simple one decimal place CPI fractional changes as adjusters, and the round number percentages of retail sales for each business group shown in Robert Oak’s retail sale pie graph above for the percentage of each of the retail components included in the total. Imposing any more math than that on figures that are subject to considerable further revision would be a fool’s errand.
We'll start with the largest component of retail sales, which is motor vehicle and parts dealers, which according to the table above, were up 1.2% from the third quarter (July thru Sept) to the 4th quarter (Oct to Dec). We'll adjust that with the price index for "transportation commodities less motor fuel" which includes weighted prices for new and used vehicles and tires and parts; that index was unchanged in October and November and down 0.1% in December. Using our simple math, we'll adjust the 1.2% dollar value change in motor vehicle and parts sales with the cumulative 0.1% price decrease to find that real unit sales of motor vehicles and parts were up 1.3% in the 4th quarter. Going down the table of the quarter sales changes, we find furniture store sales in dollars were up 2.2%; we adjust that with price changes for "household furnishings and supplies" over three months and find that unit sales of furniture were up 2.4%. Next, we have sales at electronics and appliance stores up 0.4% for the quarter; adjusted with the weighted price indexes for appliances and the index for video and audio products, we find that unit sales at electronics and appliance stores were actually up 1.6%. Meanwhile, dollar value sales at building material and garden supply stores were down 2.1% for the quarter; we'll adjust that with the price index for "tools, hardware, outdoor equipment and supplies" over 3 months and find that unit sales of building material and garden supplies were only down 0.5% over that period. Next on the table we see sales at food & beverage stores increased 0.9% for the month; since the food at home index was up 0.1% over three months, those unit food sales are reduced to an 0.8% increase. Next, sales at health & personal care stores, which are more commonly referred to as drug stores, were up 1.7% for the quarter; adjusting those sales with the price index for medical care commodities indicates that unit sales at drug stores were really up 2.2%. Next are sales at gas stations, which were down 0.8% in dollars for the 4th quarter, while the monthly price changes for all types of gasoline were down 2.9% in October, down another 1.6% in November, but up 3.1% in december. With a bit of compounding, we'll say gasoline prices fell 1.5% for the quarter and thus unit sales at gas stations were up 0.7% over the quarter. Clothing store sales were up 2.0%, adjusted with the apparel index, which was essentially unchanged, leaves us real sales of clothing also unchanged at 2.0%. Sales at sporting goods, hobby, book & music stores were up 3.1% in the 4th quarter; we'll adjust them with the recreational commodity price index and find that real sales of sporting goods, books & music were up 3.8%. Sales at general merchandising stores were up 0.4% in the quarter, adjusting them with the quarterly change in the price change for retail commodities less food and energy commodities indicates real sales at general merchandise stores rose 0.6% for the quarter. We'll adjust the nominal 0.5% increase in sales at miscellaneous stores with the same index and call their real quarterly sales up 0.7%. Meanwhile, sales at non-store retailers were up 2.3% for the quarter; we've previously decided to adjust those mostly online sales with a weighted combination of software and book prices, consumer electronics prices, and the apparel price index which would result a 2.9% increase in real online sales. Lastly, sales at bars and restaurants were up 3.0% during the 4th quarter; adjusting those for the half percent rise in prices for food away from home means real restaurant sales rose 2.5%.
Now, we have to add all those real price changes together with their proper weighting to get the real price change for all retail sales. As we originally said, instead of using exact percentages for weighting, we're using the whole number percentages shown in Robert Oak’s pie graph. Thus, as vehicle sales are 19% of retail, we multiply the 1.3% real increase in motor vehicles and parts sales by that to get their portion of the increase in retail; then we add to that the 2% of retail represented by furniture sales multiplied by their real increase of 2.4%, and so on. So, to take a shortcut directly to the math, the change in real retail sales = 19% * 1.3% + 2% * 2.4% + 2% * 1.6% + 6%* -.5% + 13% * 0.8% + 6% * 2.2% + 10% *.7% + 5% * 2% + 2% * 3.8% + 13% * 0.6% + 2% * .7% + 9% * 2.9% + 11% * 2.5%, which equals 1.407% if we've done our math right (someone check that and get back to me). So our real personal consumption of goods appears to have risen 1.4% in the 4th quarter, which would be at a 5.75% annual rate. Since personal consumption of goods is approximately 23% of GDP, we can estimate that real retail sales will add roughly 1.32% to 4th quarter GDP...
(cross posted from MarketWatch 666)
Recent comments