
The Trade deficit increased $2.7 billion from last month to $39.7 billion. Exports increased $0.3 billion where imports increased $3.0 billion from January.
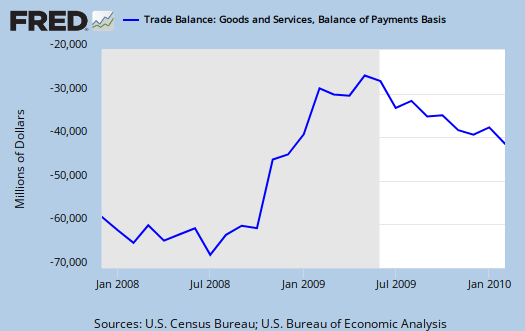
February exports of $143.2 billion and imports of $182.9 billion resulted in a goods and services deficit of $39.7 billion, up from $37.0 billion in January, revised. February exports were $0.3 billion more than January exports of $142.9 billion. February imports were $3.0 billion more than January imports of $179.8 billion.
Below are imports vs. exports of goods from the official start of this recession. Notice the flat line on exports.

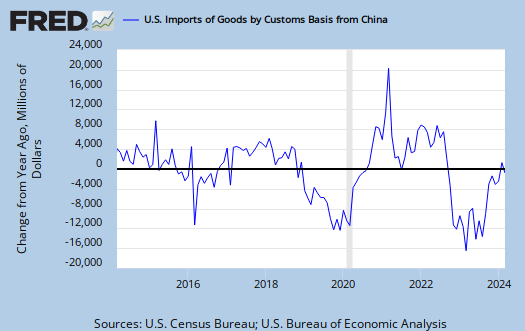
Since Chinese currency manipulation has the potential to be confronted by Congress, here is the annual percent change of Chinese imports into the United States. As one can see, while the recession affected global trade, the same imbalance is still present and returning to pre-recession levels. Note, there is a lot of volatility in the trade imbalance with China, so looking over the overall trend line is key.
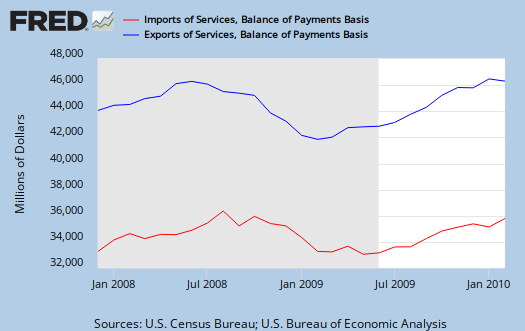
The below graph are services of imports vs. exports.
Here are goods alone. Goods make up the bulk of trade.
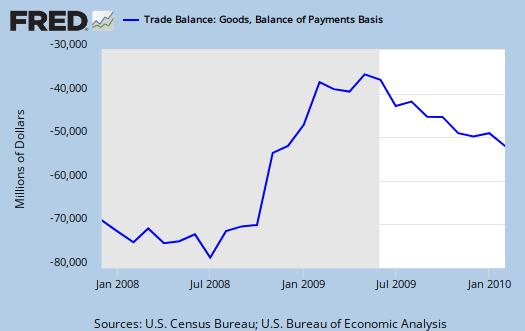
In February, the goods deficit increased $1.9 billion from January to $51.3 billion, and the services surplus decreased $0.8 billion to $11.6 billion. Exports of goods increased $0.1 billion to $98.5 billion, and imports of goods increased $2.0 billion to $149.8 billion. Exports of services increased $0.2 billion to $44.7 billion, and imports of services increased $1.0 billion to $33.1 billion.
Below are Petroleum imports, as reported on March 31st:
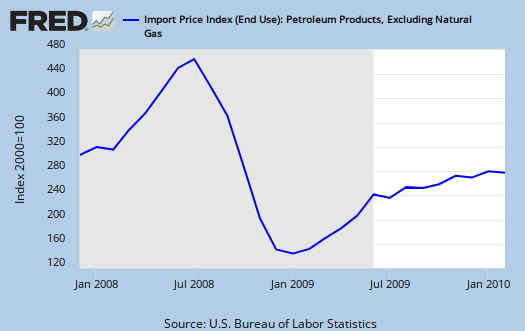
Here are all imports, minus petroleum, data end date February 2010, reported on March 31. As one can see, it's not petroleum causing the sudden increase in the trade deficit numbers this time.

As the global economy recovers, it appears the trade deficit is on the same upward trend line, on the path to, but in absolute numbers, no where near yet, pre-recession levels. The same trade deficit that has plagued the U.S. economy and the American worker is alive and well. Here is a graph of our growing trade deficit, indexed to 1992. Note the dramatic increase after year 2002, the same year offshore outsourcing really hit the corporate board rooms as a must do mantra. The China PNTR was signed in 2000. If you can believe this, the Senate vote was 83-15.

Here is the U.S. INTERNATIONAL TRADE IN GOODS AND SERVICES February 2010 release. I suggest looking over exhibits 7 and 8. One can see just how much of our real industries have been hollowed out and also how important it is to manufacture aircraft in the United States. Compare the two exhibits, you'll see a host of products which used to be made in the United States, now being listed as imports.
Subject Meta:
Forum Categories:
| Attachment | Size |
|---|---|
| 370.13 KB |
Recent comments