The economy is always a yin and yang, with one thing tending to counterbalance another. In the past I have frequently differentiated one such tension between the "Kudlow economy" for the top 20% (actually more like top 5%) which prospered mightily during the Bush/GOP malAdministration, and the "Bonddad economy" of the bottom 80%, which saw little or nothing of the alleged prosperity.
Until late last year, consumption in the Kudlow economy more than balanced the distress in the Bonddad economy. Then, the balance changed.
I am here to deliver a message which I fear will be as welcome as a skunk at a wedding reception: I believe the balance is about to change again, at least briefly, back in favor of the Kudlow economy. Even if you disagree strongly, I hope you take the time to consider the evidence I amass below.
The same indicators which led me to believe at the end of 2006, that we were likely to enter a recession by the end of 2007, are now telling me that the recession of 2008 is likely to be over by Election Day.
The Most Reliable Leading Indicators
The Conference Board reports each month on Leading Economic Indicators, that is, signs of what lies ahead for the economy. They are:
Money supply, M2
Average weekly hours, manufacturing
Average weekly initial claims for unemployment insurance
Interest rate spread, 10-year Treasury bonds less federal funds
Manufacturers’ new orders, consumer goods and materials
Vendor performance, slower deliveries diffusion index
Manufacturers’ new orders, nondefense capital goods
Building permits, new private housing units
Stock prices, 500 common stocks
Index of consumer expectations
Of these, the first three are the most heavily weighted components.
But the Conference Board has come under fire for constantly rejiggering the list. So, last year (more precisely, on March 30, 2007), Mike Shedlock a/k/a Mish discussed the spotty record of many of the above components and instead posted two series which put together constituted a Mish's perfect recession indicator. Those 2 are (1) an inverted yield curve (specifically 10 year treasury bond yielding less interest that a 3 month treasury bill); and (2) a negative inflation adjusted "M prime" which is a somewhat enhanced version of the supply of money described most narrowly, called M1.
As he put it:
In conjunction with an inverted yield curve M' is a perfect six of six with no false positives.
If you can't make sense of that explanation, don't worry. The bottom line is, when you put those two together, they have a perfect record of spotting recessions going back almost 50 years. And on March 30, 2007, Mish wrote that they were forecasting a recession within 12 months. Of course it now looks like he was exactly right.
So that you can see what he was talking about, here is a graph of the interest rate paid on the 30 year treasury (blue) vs. the interest rate paid on a 3 month treasury (red).
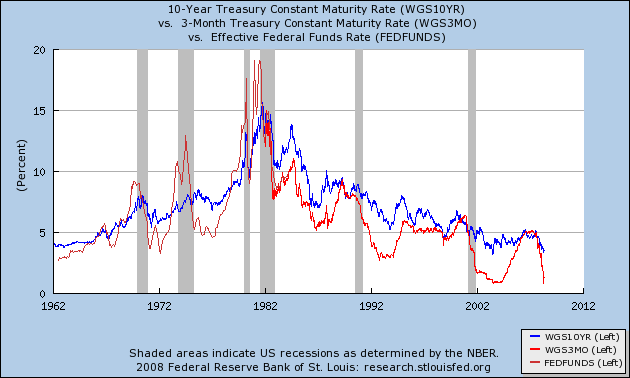
Notice how, within about 12 months of every single recession, the red line is higher than the blue line (meaning you get more interest on a 3 month bill than a 10 year bond -- a very unusual occurence. This is what is known as an "inverted yield curve." But also notice that there is 3 false reading, from 1966.
Now, here is Mish's graph of "inflation adjusted M prime":
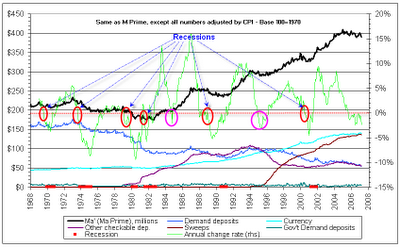
This graph starts after 1966, but is strongly positive for the mid 1990s, thus negating any false positives from the inverted yield curve chart.
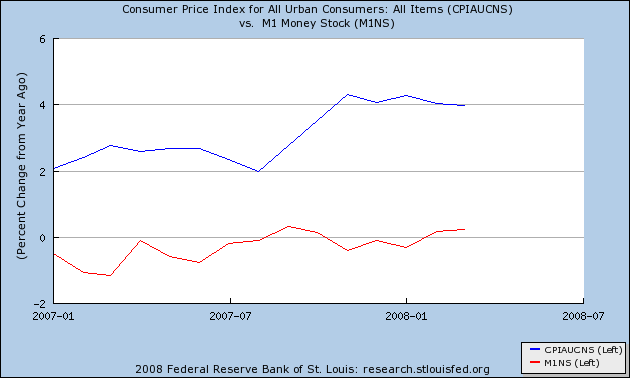
The data Mish uses to calculate "M prime" is partly proprietary. We can come close, though, but substituting M1 (the basic money supply from the Fed) (red) and comparing it with the official headline inflation rate (blue):
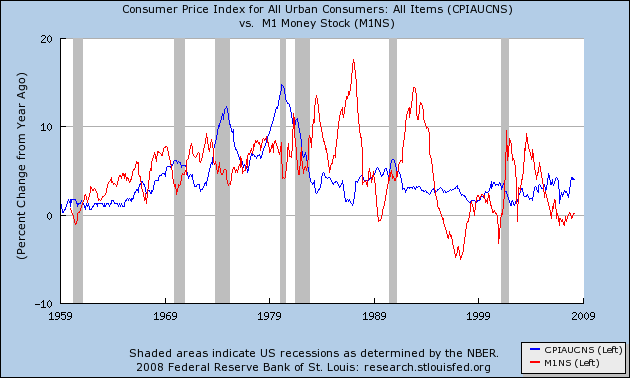
Notice that the blue line exceeds the red line just before each an every recession, but also gives a few false readings, again from the mid 1960s and again in the mid 1990s.
When both unequivocally give negative readings, with one exception (a few months in 1966-67) you are approaching or in a recession.
A similar technique has been calulated by several academic advisors, involving the yield curve (as above) and the Fed Funds rate. Called Reckoning the Odds of Recession:
Political Calculations' Recession Probability Track shows the probability that the U.S. economy will be in recession 12 months from the indicated date (shown in red) while revealing the probability trend over the past four years.
And here is what that chart has shown from 2004 to the present:

Note that like Mish's calculations, in April 2007 it showed a 50% chance of recession right now, in April 2008.
So both of these sets of indicators correctly and in the face of much skepticism, accurately called the recession we have entered in December 2007 or early 2008.
So, what are they saying now?
You may already have noticed that the chart directly above has moved decisively away from showing recession. In fact, it suggests that we are at the trough of the recession right now, and there is less than a 10% chance that this recession will still be going on by April 2009!
Similarly, here is a close-up of the yield curve from 2007 to the present:
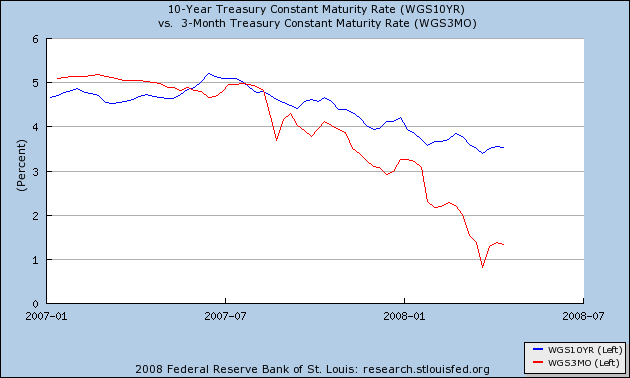
As of about August 2007, the yield curve inversion ended. The yield curve is now strongly positive, again indicating that by about Labor Day, this recession is likely to have ended.
There are some other signs that indicate that this recession may have hit its trough. First of all, the performance of the stock market, specifically the S&P 500 index of large stocks, is a (weakly) leading indicator. For all of the sturm and drang we have read here recently about market losses, here is a graph of the S&P for the last 3 months:
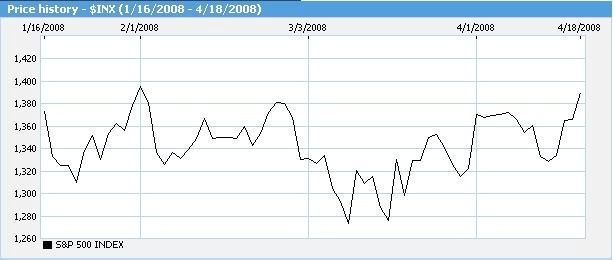
That is not a declining market. It is a sideways market. And many of the interest rate and sentiment signs which stock market watchers look at are also bullish for stocks -- for example, corporate and Wall Street insiders are relatively bullish, while newsletter writers and the public are relatively bearish -- suggest that the downwrard trend is over. You can find all off these indicators at the Barron's market lab site.
Two other leading economic indicators. durable goods orders and new factory orders, which had been declining at the end of 2006 and early 2007, and led me to conclude that a recession by the end of 2007 was likely, are now decidedly positive uptrend. From the Barron's site:
Durable goods, (bil. $) (Feb 2008) 210.6 (Feb 2007) 206.9
Factory orders, backlog (mil. $) (Feb 2008) 822.39 (Feb 2007) 693.33
New factory orders, (bil. $) (Feb 2008) 424.42 (Feb 2007) 400.49
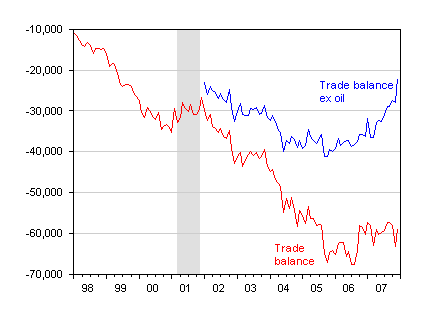
This probably has to do with the declining dollar making American goods cheaper than competitive goods in many markets. And indeed, here is a graph of our balance of trade (exports vs. imports), showing a very robust uptrend ex oil:
Why is the Kudlow economy reasserting itself?
As Russ Winter so ably showed, the top 5% are amost never going to be dramatically affected by an economic slowdown. And in our current stratified economy, the bottom 80% of Americans don't even control a majority of the income:
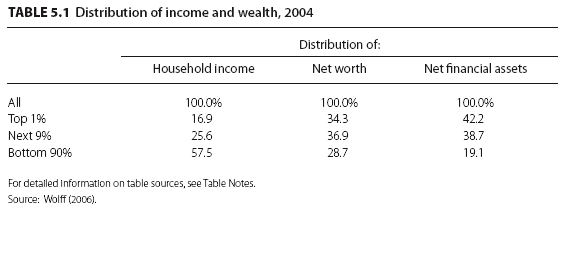
So the balance boils down to the 5th-20th% of affluent and upper middle class Americans. Late last year, about when gas hit $3 a gallon, they started pulling in their horns, and "affordable luxury" stores like Nordstrums and Coach started feeling the pinch.
But, as the anit-housing-bailout siteAngry Renter reports, 59% of Americans are either renters or are homeowners who do not carry a mortgage. Only 7% are delinquent or in foreclosure. And certainly not all of the remaining 33% have succumbed to Home Equity Lines Of Credit (a/k/a HELOCs). Those people are not directly affected at all by the housing bust. Their budgets remain on the same footing as before.
Thus, retail sales are still nominally positive year over year:
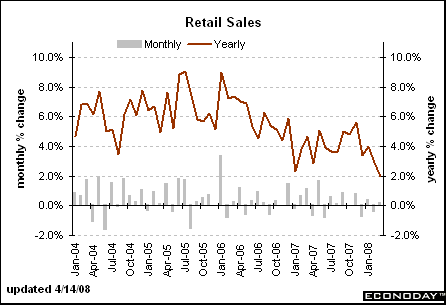
showing that consumers have not cut back spending. They have instead re-allocated spending away from such discretionary items as appliances and restaurants, in order to compensate for the higher prices of gasoline and food. In a typical consumer recession, consumers actually cut back significantly in order to rebuild their savings. The data don't show that happening yet.
And while financial companies like Citigroup may be hurting, companies which actually make things, like Caterpillar, are reporting blowout earnings, due primarily to sales overseas:
Caterpillar Inc. said first-quarter profit rose 13 percent, beating estimates as equipment sales in China, the Middle East and emerging markets grew about seven times faster than in North America.
a result no doobt of the trashing of the dollar.
What to Watch for
There are two important clues to watch for if the recession is indeed going to end before election day. The first goes back to Mish's "M prime". A close exam of the M1 vs. CPI graph above would show you that with 2 exceptions, M1 grew to within 1/2% of CPI right at the close of the recession. The two exceptions (the oil crises of 1974 and 1980) saw M1 at its worst levels right at the end of the recession, followed immediately by sharp rebounds. Look for either of those, and if one occurs, that is a signal that this recession is over. Here's what the graph looks like as of now, so we're not there yet:
Hanging over all of this, of course, is the price of oil (which also is driving the cost of food). It is difficult to imagine how the economy might rebound if oil continues to double in price on a year-over-year basis, as bonddad has shown on his own blog with this very helpful graph:
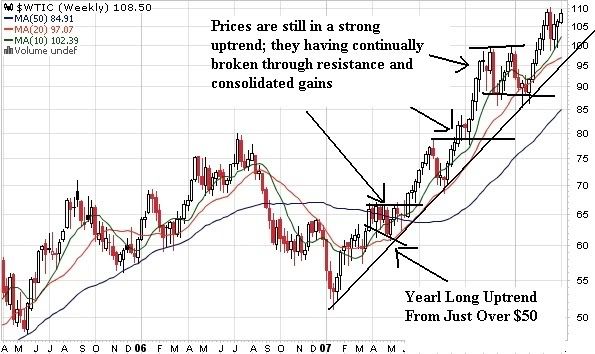
When the uptrend identified by bonddad in that graph breaks, that is when inflation will start to decline, and that is likely to be a strong signal that the recession is ending. Evidence is, that will happen sometime between the Fourth of July and Election Day.
But the middle/working class pain will go on. Essentially, Bernancke's rate cuts, which trashed the dollar, have bought the economy a little time. But the underlying structural weaknesses of too much debt and too little wealth going to average Americans, of too much financial engineering, and a burst housing bubble will remain. In that regard we do have a model. At the time of the last oil shock, in 1980, the Federal Reserve, lowered interest rates (shown in green) to well below the CPI (in blue), and even 30 year bonds (in red) paid less interest than that prevailing inflation rate -- exactly as Bernancke has done now. Like a junkie taking one last hit, the economy rebounded briefly, but the structural problem still remained unaddressed. And under a new Fed chairman, Volker, the problems were addressed with no mercy, leading beyond recession to a depression of 10%+ unemployment in 1982:
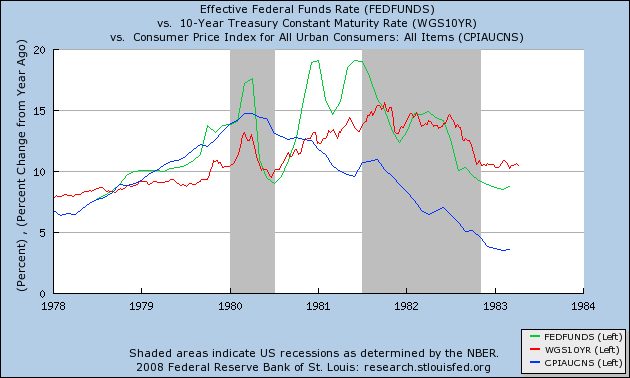
So, even while I am calling for this recession to end by Election Day, I believe we remain in a "Slow Motion Bust" during which over at least 5 years, reckless debt will slowly be destroyed. Another, deeper recession may well await us by 2010.

Comments
excellent analysis!
From watching Wall Street reward things like Citigroup for only losing $1.06 per share vs. $1.66 per share (shakes head) and JP Morgan getting rewarded despite their heavy losses, I think you're right that this "recession" which seemingly is defined only for the super rich, will end and much through a rigged game of the bail-out of the financials, putting onto the taxpayer the costs of this folly. For most Americans it will just continue on, much like the erosion of the middle class has been going on.
I believe that we're at the middle class squeeze blood out of a stone point by the financials. Yet the Fed seems intent on extending this Ponzi game by dumping it all onto the taxpayer long term.
That was something in the Elizabeth Warren Lecture (my recent post) I saw, was she was trying to differentiate between the US poor and middle class and I was thinking, hmmm...there really isn't much difference if one is one paycheck or illness away from bankruptcy and poverty.
Tim Duy of the U. of Oregon agrees with my analysis
for almost identical reasons.
Here's his article over at Economist's view.
Great analysis
Great post and the amount of analysis you had is excellent. Despite the recession draggin on, it is good to see another optimistic viewpoint (relatively speaking). I think the recession will be over as fast as it started, though the structural changes will last for much longer. Now is the time to make the best of the opportunities available.
Heh
I think I wrote this diary back in March. In July I backed off based on a look at pre-WW 2 yield curves writing that, Surprise! Positive Yield curves haven't always been positive for the economy, and noted: