u-6

Jobs Report Show 163,000 Jobs, Unemployment Rate of 8.3%

The July 2012 BLS unemployment report shows total nonfarm payroll jobs gained were 163,000. Don't get too excited, while above expectations this is still a mediocre report. June's payrolls were revised down, from 80,000 to 64,000. May's payrolls were revised up, from 77,000 to 87,000. The below graph shows the monthly change in nonfarm payrolls employment.


Job JOLTS - There are 3.5 Unemployed People Per Job Opening for May 2012

The BLS JOLTS, or Job Openings and Labor Turnover Survey reports the never ceasing abysmal jobs market. The May 2012 statistics show there were 3.5 official unemployed persons for every position available*. There were 3,642,000 job openings for May 2012, a 5.7% increase from the previous month of 3,447,000. Openings are still way below pre-recession levels of 4.7 million. Job openings have increased 67% from their July 2009 trough, yet opportunities are miles away from the 1.8 persons per job opening ratio at the start of the recession, December 2007. Below is the graph of May official unemployed, 12.72 million, per job opening.


job openings per official unemployed


Job openings are all types of jobs, temporary, part-time, seasonal and full-time. Hires are U.S. citizens, permanent residents, illegals and foreign guest workers.

Yet Another Abysmal Jobs Report Shows Only 80,000 Jobs for June 2012

The June 2012 BLS unemployment report is another abysmal jobs report. Total nonfarm payroll jobs gained were only 80,000. May's payrolls were revised up, from 69,000 to 77,000. April job gains were revised down, again, from 77,000 to only 68,000. The below graph shows the monthly change in nonfarm payrolls employment.


Job JOLTS - There are 3.7 Unemployed People Per Job Opening for April 2012

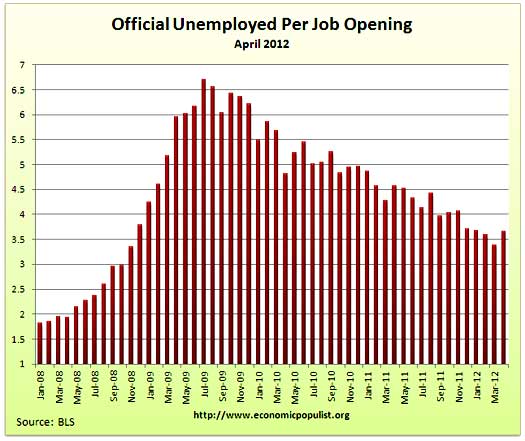
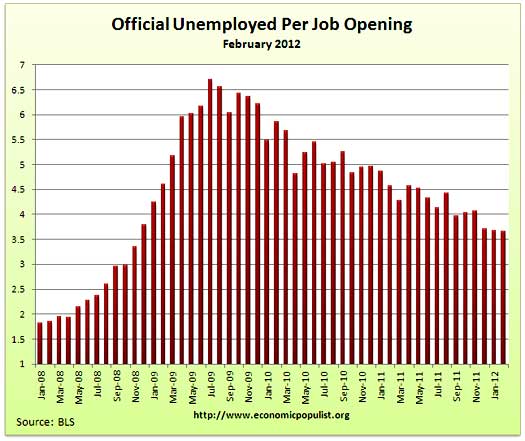
The BLS JOLTS, or Job Openings and Labor Turnover Survey reports a dismal and pathetic jobs market. The April 2012 statistics show there were 3.66 official unemployed persons for every position available*. There were 3,416,000 job openings for April 2012, a -8.69% change from the previous month of 3,741,000. Openings are still way below pre-recession levels of 4.7 million. Job openings have increased 56% from their July 2009 trough, yet opportunities are miles away from the 1.8 persons per job opening ratio at the start of the recession, December 2007. Below is the graph of April official unemployed, 12.5 million, per job opening.


job openings per official unemployed


If one takes the official broader definition of unemployment, or U-6, the ratio becomes 6.65** unemployed people per each job opening for February. The April U-6 unemployment rate was 14.5%. Below is the graph of number of unemployed, using the broader U-6 unemployment definition, per job opening.

More Depressing Unemployment Statistics for May 2012

The May employment report was dismal. This overview shows the situation is even worse than dismal, it is depressing in more ways than one. Officially there are 12.72 million people unemployed and the unemployment rate is 8.2%. We calculate below an alternative unemployment rate of 16.8%, which shows 27.11 million people need a full-time, real job.

BLS Employment Report is Abysmal - Only 69,000 Jobs!

The May 2012 BLS unemployment report is abysmal. Total nonfarm payroll jobs gained were only 69,000. April job gains were revised down, from 115,000 to only 77,000. March payrolls were also revised down, from 154,000 to 143,000. The below graph shows the monthly change in nonfarm payrolls employment.


BLS payrolls 05/12


May shows only 82,000 private sector jobs gained while government payrolls shrank another -13,000. In addition, 9,200 of those jobs were temporary.

Job JOLTS - There are 3.4 Official Unemployed per Job Opening in March 2012

JOLTS stands for Job Openings and Labor Turnover Survey. The March 2012 statistics show there were 3.39 official unemployed people hunting for a job to every position available*. There were 3,737,000 job openings for March 2012, an increase of 4.83%, from the previous month of 3,565,000. The press shouts this is the largest number of jobs openings in four years, that's actually wrong. This is the highest number of job openings since July 2008. We were 8 months into the great recession and there were way less people needing a job in July 2008. Openings are still way below pre-recession levels of 4.7 million. Job openings have increased 71% from their July 2009 trough, yet opportunities are still way below the 1.8 persons per job opening at the start of the recession, December 2007. Below is the graph of March official unemployed, 12.673 million, per job opening.


jolts u-3 03/12


Alternative Unemployment Rate is 16.6% and Other Scary Unemployment Statistics

April brings showers and yet another sad employment report. The new official unemployed tally is 12,500,000 with an unemployment rate of 8.1%. We calculate below an alternative unemployment rate of 16.62%, which shows 26.72 million people need a full-time, real job.

Job JOLTS - There are 3.66 Official Unemployed per Job Opening in February 2012

JOLTS stands for Job Openings and Labor Turnover Survey. The February 2012 statistics show there were 3.66 official unemployed people hunting for a job to every position available*. There were 3,498,000 job openings for February 2012, an increase of 0.6%, from the previous month of 3,477,000. This is no change from January 2012 in actual job openings. Job openings have increased 60% from their July 2009 trough. Yet opportunities are still way below the 1.8 persons per job opening at the start of the recession, December 2007. Below is the graph of February official unemployed, 12.806 million, per job opening.


jolts u3 02/12


Pages