The reality of the crude oil glut finally caught up with the oil price rally that had been driven by rumors of an OPEC / Russian pact last week, as oil prices fell 5% in their first weekly loss since mid-February. Almost the entirety of that drop occurred on Wednesday, after the EIA release of the weekly oil data, which showed a near record addition to our already record crude stockpiles.. While US oil for April delivery had closed last week at $39.44 a barrel, last Friday was the last day of trading for that April contract, and hence all oil price quotes this week were for the higher priced May contract, which had closed last week at $41.14. Last week's rally for that new contract continued on Monday, which saw the now widely quoted price for US crude close at $ 41.52 a barrel. Oil prices then slipped to close at $41.45 a barrel on Tuesday before crashing back to $39.79 a barrel on Wednesday, after the EIA report showed we added 9.4 million more barrels to our already record oil oversupply, more than triple what oil traders were expecting. US crude prices continued falling on Thursday, dropping below $38.40 a barrel on Thursday morning, before the release of the weekly rig count data from Baker Hughes showed another large drop in oil drilling activity, which drove the price back up to end Thursday and the trading week at $39.46 a barrel.
This Week's EIA data, and a look at our oil production
Tthis week’s big oil inventory increase was largely due to a jump in our imports of crude, which surged to a 33 month high, while while our refining was undergoing a modest slowdown. This week's Energy Information Administration data indicated that our imports of crude oil rose to an average of 8,384,000 barrels per day during the week ending March 18th, the most oil we've imported in any week since the second week of July in 2013. Those imports were 691,000 barrels per day higher than the average of 7,693,000 barrels per day we imported during the week ending March 11th and 13.4% more than the average of 7,392,000 barrels per day we were importing during the 3rd week of March last year. Over the last 4 weeks, our oil imports have now averaged 8.1 million barrels per day, 11.6% more than we were importing during the same four-week period of last year.
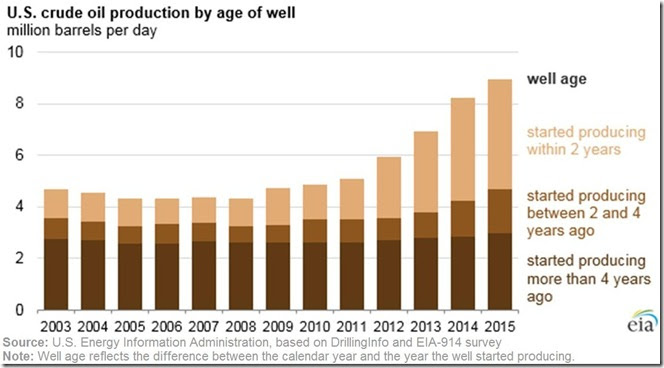
At the same time, our field production of crude oil was averaging 9,038,000 barrels per day during the week ending March 18th, 30,000 barrels per day less than the 9,068,000 barrels per day we were producing domestically during the week ending March 11th. That's now 4.1% lower than the 9,422,000 barrels per day we were producing during the week ending March 20th last year, and the lowest our oil production has been since the 2nd week of November in 2014, before the Thanksgiving OPEC meeting that set the oil price collapse in motion. Still, our current production of over 9 million barrels per day is still almost double the 4.6 million barrel per day average that we saw during the last 4 months of 2008, before fracking production really kicked in. A couple graphs from the recent EIA blog posts published daily under the heading of "Today in Energy" helps put our current production of oil in perspective. The first one, below, comes from the EIA blog post titled "Wells drilled since start of 2014 provided nearly half of Lower 48 oil production in 2015", which was published on Tuesday of this week..
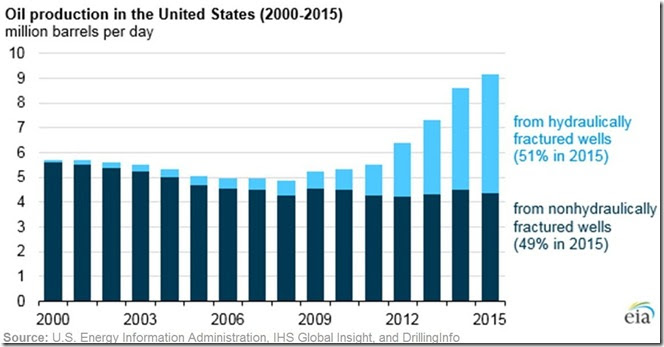
The bar graph above shows our average total crude oil production annually in millions of barrels per day since 2003, with the size of each bar graphically indicating that production. Then, within each year-bar, the amount of each year's production that came from new wells, under two years old, is indicated by the beige coloration, the amount of that year's production that came from 2 to 4 year old wells is indicated by the light brown coloration, and the amount of the given year's production that came from wells older than four years is indicated by the dark brown. Here we can see that an increasing percentage of our production has been coming from those newer wells each year, even as the production from older wells held steady. Also note that the 2014 and 2015 production from wells two to four years old is considerably less than what those wells yielded when they were newer, ie, when those wells were in the beige portion of 2012 and 2013. The next graph we'll look at, which comes from the EIA blog post titled "Hydraulic fracturing accounts for about half of current U.S. crude oil production", published on March 15th, goes a long way to explain that...
Like the first graph, this graph shows our average total crude oil production annually in millions of barrels per day since 2000, with the size of each bar graphically indicating that production. However, instead of by age, each bar above is divided into production from fracked wells, in light blue, and production from conventional wells, in dark blue. I'm sure no one is surprised that fracked wells accounted for very little of our production before 2008, and that such fracked wells accounted for more than half of our production in the year just ended. But reflect on that fact when remembering what we saw in the first graph, that recent production from wells two to four years old has been considerably less than what those wells were yielding when they were new. This aggregate data is clear evidence of the rapid depletion of oil wells drilled into shale and fracked, wherein they get that large burst of production during the first few months, but that fracked well production typically falls by 80% after two years have passed, and continues to fall annually from there. For a picture of that, we'll include an old graphic from a report from the North.Dakota Dept of Resources (pdf), which shows the production over time from a typical well in the Bakken shale, which is still the most productive oil field in the US. It should be pretty obvious what the graph below says about the light blue portions of the graph above, and the future output of the new 2015 wells on the first graph when they're two to four years old...
Returning to our synopsis of current EIA data, even with this week's large jump in crude oil imports, refining of that crude slowed for the 1st time in 5 weeks, as U.S. crude oil refinery inputs averaged 15,820,000 barrels per day during the week ending March 18th, down by 176,000 barrels per day from the prior week, as the US refinery utilization rate slipped to 88.4%, down from 89.0% during the week of March 11th, a slowdown not unexpected at this time of year, when some refineries are still switching over to summer blends. Nonetheless, we still refined 1.9% more crude than the 15,530,000 barrels per day we refined during the week ending March 20th last year, even though we were using less than the 89.0% of refinery capacity that was in use a year ago..
With less oil being refined, our refinery production of gasoline fell by 332,000 barrels per day to 9,683,000 barrels per day during week ending March 18th, down from the seven month high of 10,015,000 barrels per day of gasoline output we saw during week ending the 11th. Still, this week's gasoline output was 7.3% higher than the 9,024,000 barrels per day of gasoline we were producing during week ending March 20th last year, which itself was already above the average range for gasoline production at this time of year. Meanwhile, our refinery output of distillate fuels (ie, diesel fuel and heat oil) also fell slightly, decreasing by 39,000 barrels per day to 4,781,000 barrels per day during week ending the 11th, which was still 10,000 barrels per day higher than our distillates production during the same week of 2015...
With the decrease in gasoline production, combined with a 301,000 barrel per day drop to 415,000 barrels per day in our gasoline imports, gasoline needed to be withdrawn from storage to meet the demand, even though that demand fell from 9,458,000 barrels per day during the week ending March 11th to 9,411,000 barrels per day in this reporting week. Thus we saw another drop of our gasoline stores, as our gasoline inventories fell by 4,642,000 barrels, from 249,716,000 barrels last week to 245,074,000 barrels as of March 18th. But this weeks stores were still 5.0% higher than the 233,386,000 barrels of gasoline that we had stored at the end of the same week last year, which were at the time the highest for that week since 1990, and thus our gasoline stores are still well above the average range of for the third week of MarcH. However, our distillate fuel inventories rose despite lower production, increasing by 1,119,000 barrels to a total of 162,260,000 barrels as of March 18th, as the week saw an unseasonable 497,000 barrel per day drop in demand for distillates. With the ongoing warm winter, our stocks of distillates thus remained well above the upper limit of the average range for this time of year, measuring 28.9% greater than the 125,849,000 barrels of distillates we had stored during the same week last year..
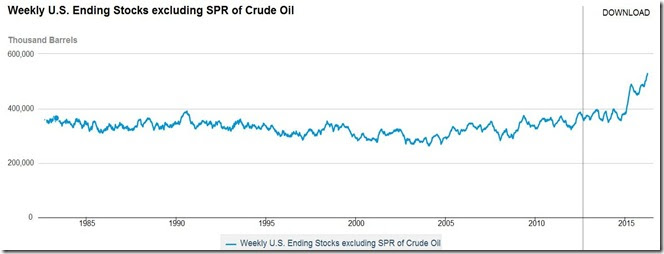
Finally, after combining the large jump in imports with the downturn in refining, we once again ended the week with even more excess crude in the country than the record level that we had last week, as our total inventories of crude oil in storage, not counting what's in the government's Strategic Petroleum Reserve, rose by 9,357,000 barrels, increasing from 523,178,000 barrels on March 11th to 532,535,000 barrels on March 18th. Thus our glut of crude remained 14.1% higher than the then record glut of 466,678,000 barrels in the same week last year, and roughly 39.2% above the 382,471,000 barrels of oil we had stored at the end of the 3rd week of March two years ago, in what could be considered a more normal level of oil supplies for this time of year. We've now increased our inventories of crude oil by nearly 50.0 million barrels over the last 10 weeks, setting new records for the amount oil we had in storage in the US in each of the last six of them. Below, we'll include the most recent 20 years of the long term graph that accompanies the EIA data page for the Weekly U.S. Ending Stocks of Crude Oil, so you can see how this glut oil oil in storage has built up over the past year and a half. Notice how our supplies started running up at the same time oil prices collapsed at the end of 2014, paused seasonally last summer as refineries were running at a record pace, and have since resumed their surge since the autumn of this past year:
(NB: the above was excerpted from my weekly post at Focus on Fracking, where there is much more)


.png)

Comments
So the upside for the price
So the upside for the price of crude seems relatively capped at least in the short to mid term, but is there real downside? As long as this dollar weakness persists crude will probably chop in a range and neither side will get paid out well.
no agreement at Doha
we still have a record glut and the talks at Doha this weekend failed to produce an agreement to cap oil output at current levels, with the Saudis even threatening to pump another million barrels a day, so we may yet test February's lows
rjs