
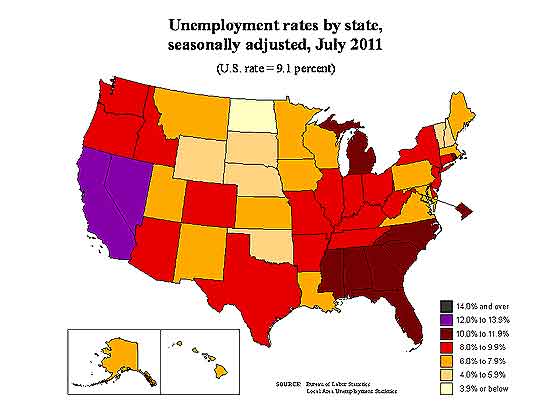
The State Unemployment statistics for July were released by the BLS on Friday. These regions, in order, have unemployment rates at or above 10%: Nevada, 12.9%, California, 12.0%, Michigan 10.9%, South Carolina, 10.9%, District of Columbia, 10.8%, Rhode Island, 10.8%, Florida, 10.7%, Georgia 10.1%, North Carolina, 10.1%, Alabama, 10%. Below is the BLS map of unemployment rates for each state.
Much has been made on Texas creating jobs and this report gives plenty of ammo for that argument. Over the past year, Texas has the largest increase in payroll jobs. What is not discussed is the corresponding increase in Texas population.
Over the month, 15 states recorded statistically significant changes in employment. The four states reporting the largest over-the-month statistically significant job gains were New York (+29,400), Texas (+29,300), Michigan (+23,000), and Tennessee (+14,300). Over-the-month statistically significant declines in employment occurred in Illinois (-24,900), Florida (-22,100), Minnesota (-19,800), and Indiana (-10,100).
Over the year, 24 states experienced statistically significant changes in employment, 23 of which were increases. The largest increase occurred in Texas (+269,500), followed by California (+189,600), New York (+106,600), and Ohio (+74,100). The only state with an over-the-year statistically significant decrease was Indiana (-28,300).
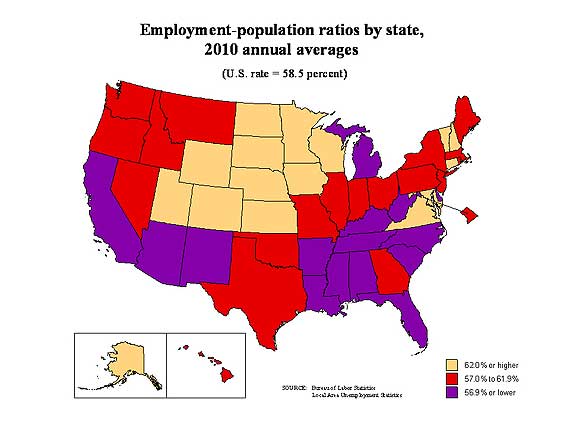
Below are States' employment to non-institutional population ratios for 2010. As we can see some states have artificially low rates. This can be due to an increased population of retirees who are part of the non-institutional civilian population, but also can be an increase in people who have given up and are not counted as part of the labor force.
Bottom line, when looking at payroll changes across states, one must take into account that states population, which is why the actual official unemployment rates matter. The Texas unenmployment rate is 8.4%.
The BLS also gave a table of current employment rates per state versus historic highs and lows. Seems 1983 was a pretty bad year although unemployment rates fairly rapidly declined, unlike now.
Except for North Dakota, with a greater than 3.1% payrolls job increase and the lowest unemployment rate in the nation, 3.3%, that is the real miracle state, the one to examine further on what they are doing so right.
Numbers games
A method note. Remember that in the Midwestern/heavily agricultural states, those "low" unemployment figures (presumably U3?) reflect some very bad, hidden, U6 truths.
The usual BLS figures are usually for NONFARM unemployment.
Most figures I've seen on that put farm workers at about 10-12% unemployment. Convert the nonfarm U3 to U6, then add in farmworker unemployment...and I'm willing to bet those lovely yellow and orange states would quickly be painted black.
FARM labor
At least in productivity, Farm accounts for about 1% of economic activity. You are right on nonfarm for state data releases....and let's face it, AG is also ignored because it's front loaded with illegal labor too. I think you mean painted red, as in there would be many more states with > 10% unemployment rates. Assuredly true.
If you just did U6, ignore FARM, most of the map would turn red.
Analyzing state data is a true blue project, there are 50 individual data sets to look at, not for the faint of heart. Of course since Texas is being declared a "miracle" due to the never ending economic creationism going on, I might do a piece on just North Dakota, for they have been doing exceeding well the entire time, they have a state bank, a host of policies different from the rest of the nation and it's even more impressive considering the landscape and weather there is like hell on Earth. Sorry ND, not exactly a vacation spot in my experience.
I need to get some mapping software going here, and of course nothing easy to use that's free or cheap so far. But to me, that's the only way to manage state data unless one does each State by itself as a post. (that's 50 posts! 51 if you include D.C. and it should be).
AG "front loaded with illegal labor"
Yeah, hard to count. Sometimes 2 on a payroll suffice for 10 actually working. But that's probably not true for North Dakota, for example.
Smiley-face start-up hopes fading
Check out John Robertson's The new firm employment puzzle at Atlanta Fed's microblog.
I don't think there's anything wrong with the start-ups small-business-creates-jobs theory, as such. Problem is that, like many another great economic theory, there are important preconditions that must first be satisfied.
I'll give the cons their due -- an important precondition would be NOT the 2010 Affordable Health Care Act.
But I'll also give the progressives their due -- an important precondition would be Single Payer or some other 'socialist' scheme, plus, NOT more FTAs.
And, for my 2¢, an important precondition would be some kind of return to protectionism, elimination of tax loopholes favoring MNCs, some way to free domestic producers from being forced to subsidize their foreign competition.
excellent research by the BLS plus terrible news
That's just god awful actually but not surprising, I'm wondering if this can be blamed on increased productivity due to technological advances. (that's rare for me to bring that up), but very good research, thanks for bringing it to people's attention.
Technology + work harder, longer hours
Yes, that's what Robertson speculates too, when looking at the "establishment size trend" --
There may be more to it than technology though. Maybe it's also part of the overall "fewer workers = greater productivity-per-worker trend."
I have eyeballed the average, approximately, from the graph, going from 6 to 4. But it would be helpful to know median and mode, to begin to investigate under the surface of this trend. Mainly, I'd want to see data by industry -- construction, fishing, auto repair shops, retail, farm labor contractors -- but it would require more time and resources than I have to research the numbers for validity and reliability. You'd have to start with qualitative research, lots of case studies.
I like the "new technologies and processes" explanation along with increased productivity-per-worker trend -- work more hours, harder, because that's what it takes to survive. That correlates with my observations in the real world (what Animist Drive-by calls "meatlife").
Hollowing of America: Start It Here, Design It, Move It Offshore
Look closely at the BED graphs and you will observe a noticeable lag between the down graphs of business starts and employment. This is because the 'Automate, Emigrate, or Evaporate' 80's mantra from the Economic Suicide Lobby convinced every one to try to move offshore in all cases, then automate the remaining processes, then move the shreds of the business, like IT, Marketing and Management in a second wave offshore.
Best example is 3Com (HuaWei).
Start ups will create new business models and processes which will be moved offshore. So we now have a big trade deficit in technology hardware mostly filled in by software. Software too is being rapidly outsouced, offshored and replaced by Visa Workers domestically.
Basically, there is no bottom, or limit to the destructive tendencies in this model of capitalism until you reach the status of the 3rd World.
How close are we to 3rd World Status? Canada is discretely telling U.S. Visa applicants that they are not welcome now for applications for citizenship, even
applicants with lots of assets and non-work income.
Part of the puzzle
Thank you, Bakunin, for positive contribution. I am referring to your suggestion on this specific stats analysis problem, but I also agree with your negative view about outsourcing trend, which is covered in some detail (but not with graphs and all) in a recent highly relevant comment by Robert Oak. (I'll see if I can find a link to that.)
Politically, our discussion here relates to a big 'conservative' claim (or 'con') that jobs are created by small businesses, especially start-ups, so 'supply-side' has to work. I agree that jobs are best created and are often created by start-ups, sparking a recovery when necessary preconditions are met. There is a supply-side to it. But the claim of the Money Party that they represent small business people and that somehow global finance capitalism will provide the necessary supply-side and make start-up capital available to working people looking to organize small businesses ... that's a con. Of course, the neo-con claim is much simpler -- that it's just the rich who create jobs, and that's the whole of it. Give the rich all the money and everything will take care of itself. And the rich, we see, have recently created jobs in China and other 'emerging markets'.
Having said the above, I don't really see a clear time lag effect in the BED graphs showing both employment per firm and new firm births.
However, I'm sure the outsourcing of production and of related services is a part of what John Robertson calls (title of his blog) "The new firm employment puzzle". We have identified three factors now: (1) technology effect, (2) productivity effect (fewer people working harder with longer hours), and now, (3) outsourcing effect.
Because new firm numbers (quarterly or annual) show business births, we would expect a lag showing increased employees per firm. There could be a cancelation effect. Many small businesses are created to fill an identified niche without any great plan for growth, that is, working people may be buying jobs in a time of slow economic growth rather than looking to build empires in a time of rapid growth. It would also be interesting to look at businesses formed by immigrants in regard to the outsourcing trend, as well as extent to which increased employment in immigrant-founded new firms is of immigrants (only marginally contributing to full employment, if at all).
To research the outsourcing effect, we would need to break out new firms in the business of new products, especially new technology products, and then actually look a random sample of those firms over a period to be determined by initial qualitative research, maybe 2 or 3 years, maybe less.
Anyway, the problem for our post facto analysis is that we seem to have a huge outsourcing trend in all firms and John Robertson hasn't given us charts or graphs breaking out newer firms from older established firms, although he has shown down trend for all firms in three graphs -- so we could try to derive some numbers from that with the new firm data but how meaningful would that be?
Bakunin ... and don't forget America's own Voltairine de Cleyre
________
Here's the link to the relevant comment by Robert Oak and a quote from it --