The Consumer Price Index for November 2010 increased 0.1% from last month. For the year, the Consumer Price Index for all Urban Consumers (CPI-U) has risen 1.1%. Core CPI, or all items less food and energy, also increased, 0.1%, it's first increase in 4 months. For the year, core CPI, or minus food and energy, is off it's record lows, now at 0.8%.
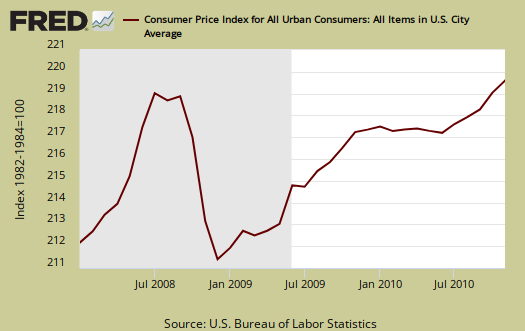
Since we have analysts claiming inflation is here, the above graph is the seasonally adjusted CPI-U index, absolute. Firstly, we're not at record highs and then if one looks at slope, or the rate of change on CPI, it's much flatter than it was before the recession. Sorry folks to disappoint, but the Federal Reserve's actions have not yet lead to a Weimar Republic.
Below is the monthly percentage change in CPI-U. See any wheelbarrows yet?
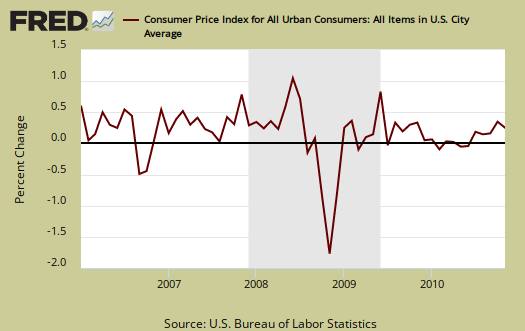
Inflation is clearly not here, coming off of a record low percent change in core CPI last month.
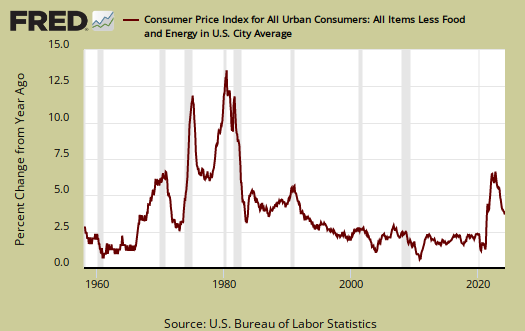
Below is the St. Louis FRED graph to show the overall rate of change on core CPI. Notice how the line isn't rising as fast after the dip in 2008. It's the rate of change that is the concern and it's clearly not spikin'.
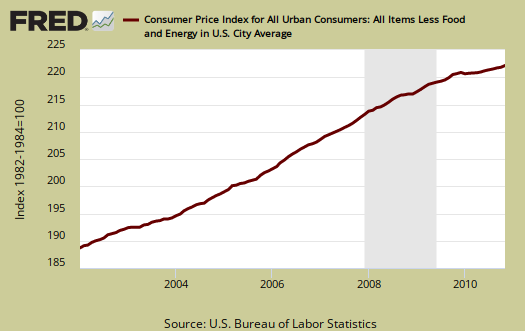
The index for all items less food and energy rose 0.1 percent in November, its first increase since July. The index for shelter rose 0.1 percent in November, the same increase as the previous month. The rent index rose 0.2 percent, its largest increase since March 2009, while the index for owners' equivalent rent rose 0.1 percent and the lodging away from home index declined 1.2 percent. The index for airline fares increased 3.0 percent in November, its largest increase in over two years. The medical care index rose 0.1 percent in November, the same increase as in October, with the indexes for medical care commodities rising 0.2 percent and the medical care services index increasing 0.1 percent. Several indexes turned up in November after declining in recent months. The index for personal care rose 0.5 percent in November following a 0.3 percent decrease in October, and the apparel index rose 0.2 percent after declining in each of the three previous months. Partially offsetting these increases were declines in the index for new vehicles, which fell 0.4 percent in November, and used cars and trucks, which fell 0.5 percent. The index for household furnishings and operations also declined, falling 0.2 percent.
The index for all items less food and energy increased 0.8 percent over the last 12 months. The shelter index has gone up 0.2 percent over that time period, the medical care index has risen 3.2 percent, and the index for used cars and trucks has increased 6.0 percent. In contrast, the indexes for household furnishings and operations has declined, falling 2.5 percent, and the new vehicles index has fallen 0.4 percent. The apparel and recreation indexes have decreased as well, falling 0.8 percent and 0.9 percent, respectively.
Below are gas prices, capturing the oil bubble in early 2008.
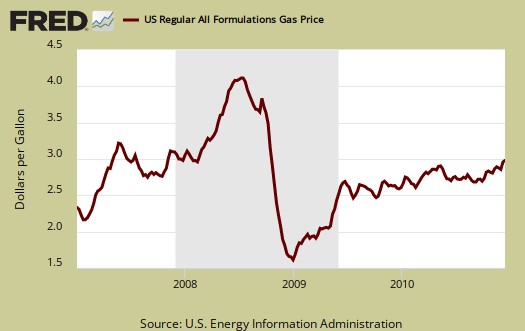
Household energy dropped -0.4% in spite of fuel oils increasing 3.5%. Eggs jumped which caused a 0.5% increase in meats, eggs, & fish on the CPI food category.
CPI-W for the month, unadjusted was 214.750, a 0.1% increase from last month.
This report is from the BLS website. These numbers are for CPI-U, whereas the metric used to calculated social security and other government payments is CPI-W.
Last month's CPI report overview is here.

Cleveland Fed, measuring inflation
by way of Calculated Risk this is a great post on measuring inflation by the Cleveland Federal Reserve.