
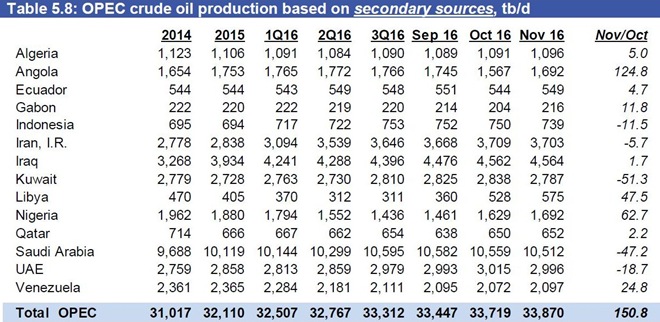
Last week saw the release of the OPEC Monthly Oil Market Report for February (pdf), which covers global oil data for January. It's the production data in that report, not the IEA estimates that we looked at last week, that will determine, by OPEC's own standards, whether their members have complied with the production cuts they have agreed to or not. This first table we’ll look at is from page 59 of the OPEC pdf and it shows oil production in thousands of barrels per day for each of the OPEC members over the recent years, quarters and months as the column headings are labeled. For all their official production measurements, OPEC uses "secondary sources", such as analyst's reports derived from satellite and shipping data, as an impartial adjudicator of their output quotas and production cuts, to resolve any potential disputes that might arise if each member reported their own figures. This is also the data we typically see quoted in the media, other than in independent analysis by energy research divisions of organizations such as Platts and Reuters that will publish their own numbers.

Here we see that the official data shows that OPEC production was down by 890,200 barrels per day in January, from a December oil production total that was revised 56,000 barrels per day lower from what was reported last month (for your reference, here is the December table before those revisions). Recall that OPEC committed to reducing their production by 1.2 million barrels per day, so these initial figures show they're not there yet. These figures are also somewhat less than the 1.04 million barrels per day that the IEA said that OPEC had cut last week, but IEA numbers started with a higher level of output for December, so their ending January production total of 32.06 million barrels per day is closer to OPEC's 32.14 million barrels per day figure. The IEA had also estimated that the Saudis had cut 560,000 barrels per day to end January at 9.98 million barrels per day, whereas these official numbers indicate the Saudis cut 496,000 barrels per day to end at 9.946 million barrels per day. The IEA also indicated smaller cuts for Iraq and the Emirates, two major producers whose cuts were half what they promised, than OPEC shows, so these figures would seem to indicate that the cooperation with the production cuts is more evenly spread than IEA figures had indicated, even if the total cut was less for OPEC overall.
The next table, also from page 59 of the OPEC pdf, shows the oil production that each of the members reported to OPEC (for those that did report)...this data is considered suspect because of the many incentives OPEC members have to fudge their data, and thus is rarely reported by the media, but i'm including it as a curiosity, because OPEC members are quite obviously reporting that they've cut their output more than the official figures show. What stands out below is that the Saudis claimed to have cut 717,600 barrels per day, while the official totals “from secondary sources" above show they've actually only cut 496,200 barrels per day. That's important because Saudi claims are usually reported by the media, and often move the price of oil.

Next, we'll include a graph of the OPEC data for all members included in this report, so we can see how this month's production stacks up next to historical figures...

The above graph, taken from the 'OPEC oil charts" page at the Peak Oil Barrel blog, shows total oil production, in thousands of barrels per day, for the 13 members of OPEC, for the period from January 2005 to January 2017. Obviously, we can see that OPEC production is down quite a bit over the past two months from their record production of 33,374,000 million barrels per day in November, in their run-up before the agreement was reached, but note that their current production is still more than what they were producing last April and May of 2016, and in fact for every other month before that, including last January, when they produced 31,628,000 barrels per day (a figure at by subtracting Indonesian production from the 14 member total they reported last year.pdf). That means that despite all of the hullabaloo they've made over cutting production, their January 2017 production of 32,139,000 barrels per day is still 1.6% more oil than they were producing in January 2016.
This next graphic we'll include, as the heading tells us, shows us both OPEC and world oil production monthly on the same graph, from February 2015 to January 2017, and it also comes from page 59 of the February OPEC Monthly Oil Market Report. The pale blue bars represent OPEC oil production in millions of barrels per day as shown on the left scale, while the purple graph represents global oil production in millions of barrels per day, and that's shown on the right scale. Global oil production fell to 95.82 million barrels per day in January, and OPEC production thus represented 33.5% of what was produced globally, a decrease from their 34.0% in December. But even with the two months of cuts we can obviously see here, global oil supply is still in surplus, as the table after this graph will show..

The table below comes from page 34 of the February OPEC Monthly Oil Market Report, and it shows oil demand in millions of barrels per day for 2016 in the first column, and OPEC's forecast for oil demand by region and globally over 2017 over the rest of the table. While the changes by region from quarter to quarter may be interesting, the reason we're including this table here today is for the forecast for oil demand in the first quarter of 2017, which is shown on the "Total world" line of the second column. OPEC projections are that during the first three months of this year, all oil consuming areas of the globe will use 94.84 million barrels of oil per day, up from the 94.62 millions of barrels of oil per day they used in 2016. But as OPEC showed us in the supply section of their report and the summary supply graph above, even with the production cuts, the world's oil producers were still producing 95.82 million barrels per day during January. That means that even after all the production cuts have take place, there was still a surplus of nearly a million barrels per day in global oil production...

(note: the above was excerpted from my weekly synopsis at Focus on Fracking)
Comments
amazing
This is really just shocking since I heard peak oil and supply will start to run out so often and in 2017, oversupply with dramatic production cuts.
no one looks at the data...
i'm seeing several media articles a day about how the OPEC cuts will restrict supply, and they're invariably cited as the reason for each oil price rise...but there it is, in black and white, two tables from OPEC own very wonkish global analysis of production and consumption that clearly say gloabl oil supply still exceeds demand by a bunch..
rjs