
New Orders in Durable Goods, advance report, increased 2.2% for February 2012. January durable goods new orders were revised, from -4.0% to -3.6%.
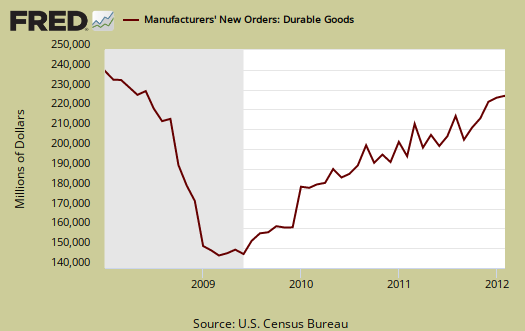
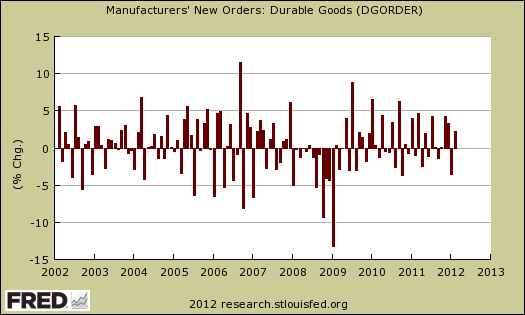
Headlines blare everything from doom and gloom to a humming economy over this report, none of which is exactly true. First, this is the advance report and is almost always revised. Secondly, anyone believing the economy is suddenly booming will of course be disappointed. There is no data, anywhere, which projects economic growth to be robust. To put monthly percentage changes in perspective, below is a graph of the monthly durable goods new orders percentage change. As we can see, durable goods has a lot of volatility month after month. Durable goods must either decline by a huge amount or contract at least for a quarter overall to really indicate something bad is happening. We now have two months of Q1 2012 and the change is negative. That said, March may surprise yet.
Shipments overall decreased -0.4% from January, in part a reflection of January's new orders plunge. Below is the monthly percent change for all durable goods shipments.

Core capital goods new orders increased 1.2%, after plunging -3.7% in January. Core capital goods is an investment gauge for the bet the private sector is placing on America's future economic growth.
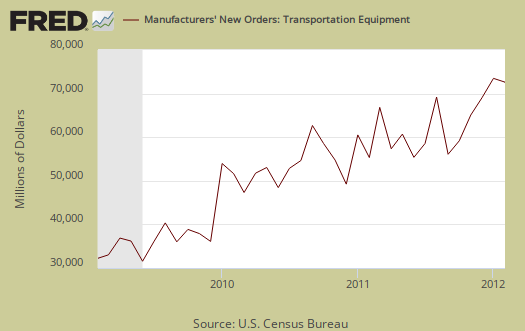
For all transportation equipment, new orders increased 3.9%, but this includes volatile aircraft. Nondefense aircraft increased 6.0% and defense aircraft increased 12.5%. It's typical for aircraft to vary dramatically, after all who orders up a billion dollar air-o-plane every day? Motor vehicles new orders increased 1.6%. Below is a graph of all transportation equipment new orders.
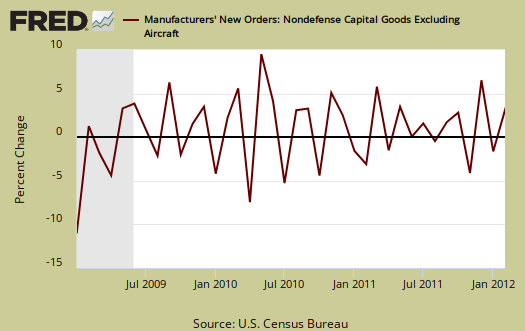
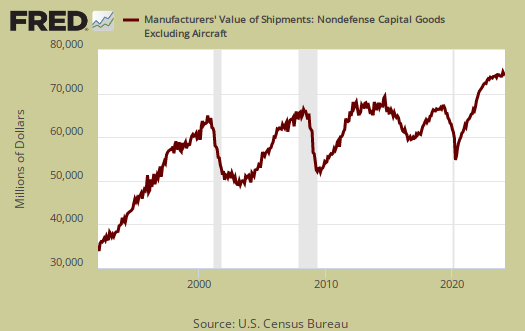
Core capital goods are a leading indicator of future economic growth. It's all of the stuff used to make other stuff, kind of an future investment in the business meter. Core capital goods excludes defense and all aircraft.
Shipments in core capital goods increased 1.4%. Machinery is a large part of core capital goods and machinery shipments increased 2.3% for the month.
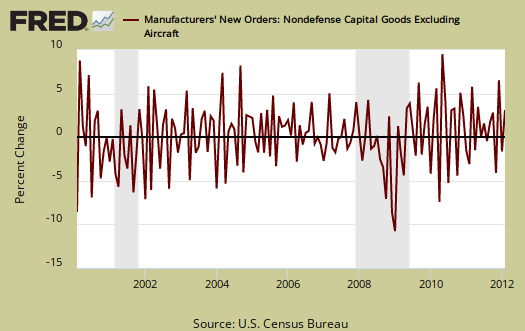
To put the monthly percentage change in perspective, below is the graph of core capital goods, monthly percentage change going back to 2000. Looks like noise right? In January 2009, core capital goods new orders dropped -9.9% and also declined by -9.4% in December 2008.
Inventories, which also contributes to GDP, are at an all time high and up +0.4% for February. Inventories have been at all time highs for months and have increased for 26 months in a row. Core Capital Goods inventories increased 0.6%. Machinery had the largest inventory increase, 0.9%.
Unfilled orders increased +1.3% with core capital goods unfilled orders also increasing by +0.7%.
Core shipments contributes to the investment component of GDP. Q1 2012 is getting off to a terrible start with an average percentage change for the first two months of -0.8% for durable core capital goods shipments.
Producer's Durable Equipment (PDE) is part of the GDP investment metric, the I in GDP or nonresidential fixed investment. It is not all, but part of the total investment categories for GDP, usually contributing about 50% to the total investment metric (except recently where inventories have been the dominant factor).
Producer's Durable Equipment (PDE) is about 75%, or 3/4th of the durable goods core capital goods shipments, in real dollars, used as an approximation.
What is a durable good? It's stuff manufactured that's supposed to last at least 3 years. Yeah, right, electronics, laptops and cell phones and crappy printers, refrigerators that break in a matter of months. Regardless, that's the definition.
Here is last month's overview, not revised, although the graphs are. One might get a sense of how strongly the durable goods report is revised as more data comes into the Census bureau.
Recent comments