
The Durable Goods, advance report shows new orders declined by -0.5% in April. In March new orders increased 5.1% yet in February, new orders dropped by -3.5%. For April, transportation was the culprit as new orders in this category dropped -2.5%. Core capital goods, on the other hand, gained 1.0%. Without transportation new orders, which includes aircraft, durable goods new orders would have increased by 0.5%. Without the Department of Defense, new orders would have increased 0.2%.

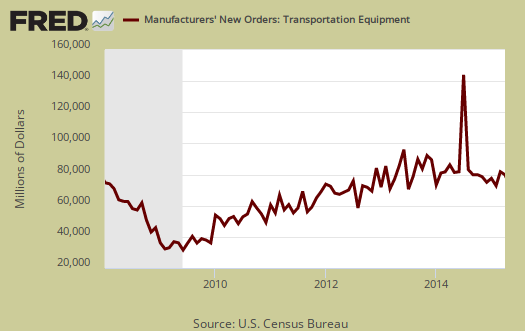
Below is a graph of all transportation equipment new orders, which dropped by -2.5% for the month. This all due to volatile aircraft orders. Motor vehicles & parts increased by 0.3%. Aircraft and parts new orders from the non-defense sector decreased -4.0%. Aircraft & parts from the defense sector decreased by -12.8%. Aircraft orders are notoriously volatile, each order is worth millions if not billions, and as a result aircraft manufacturing can skew durable goods new orders on a monthly comparison basis.
Core capital goods new orders increased by 1.0%. March's core capital goods new orders increased by 1.5%, but February was a disaster with a -5.1% decline. Core capital goods is an investment gauge for the bet the private sector is placing on America's future economic growth and excludes aircraft & parts and defense capital goods. Capital goods are things like machinery for factories, measurement equipment, truck fleets, computers and so on. Capital goods are basically the investment types of products one needs to run a business. and often big ticket items. A decline in new orders indicates businesses are not reinvesting in themselves. This month machinery new orders increased by 3.1%, while computers & electronics declined by -3.6% and primary metals increased 1.0%.

To put the monthly percentage change in perspective, below is the graph of core capital goods new orders, monthly percentage change going back to 2008. Looks like noise, even during the great recession, which tells us the monthly percentage changes in this report really need to be taken with a grain of salt and one should think quarterly. It maybe an early indicator, or simply a false alarm as these figures are nearly always revised in the more complete factory order report.

Shipments showed a slight -0.1% decline after a 1.5% increase in March. February showed a -1.1% decline. New orders are not necessarily shipped the next month an order is made. Below is the monthly shipments; percent change for all durable goods shipments.

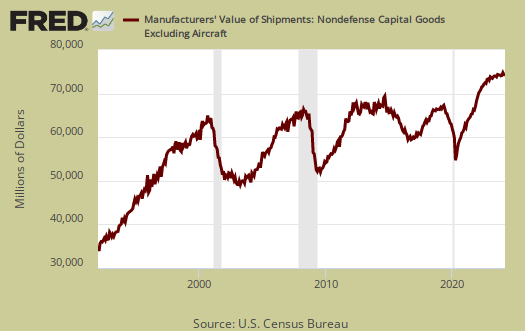
Shipments in core capital goods increased 0.8%. The below graph goes back to 1990 to show how core capital goods shipments tracks recessions, the gray bars in the graph. We'd like to see more of a pop but anything positive is better than Q1's February -5.1% decline.
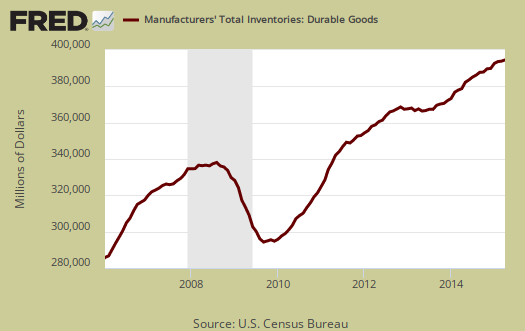
Inventories, which also contributes to GDP, increased 0.2%. March showed no change in inventories and February saw a 0.3% gain. This all implies don't expect a GDP save from changes in inventories for Q2, at least not yet from this pattern.
Core Capital Goods inventories increased 0.1% for the month. Graphed below are monthly core capital goods inventories annualized percentage change and pay close attention to the months of Q1, against the Q4 months. It is too early to see what Q2 is shaping out to be.

Core shipments contributes to the investment component of GDP. Producer's Durable Equipment (PDE) is part of the GDP investment metric, the I in GDP or nonresidential fixed investment. It is not all, but part of the total investment categories for GDP, usually contributing about 50% to the total investment metric (except recently where inventories have been the dominant factor). Producer's Durable Equipment (PDE) is about 75%, or 3/4th of the durable goods core capital goods shipments, in real dollars, used as an approximation. Below is the national accounts description of PDE:
Nonresidential PDE consists of private business purchases on capital account of new machinery, equipment such as furniture, and vehicles (except for personal-use portions of equipment purchased for both business and personal use, which are included in PCE), dealers' margins on sales of used equipment, and net purchases of used equipment from government agencies, from persons, and from the rest of the world.
The below graph might give a feel for what kind of investment component we might see in Q1 GDP revisions, out in a few days, based on PDE. Note the below is the annualized monthly percentage change of nominal values, not real, not adjusted for inflation, for core capital goods shipments.

This month's report indicates it is business as usual in durable goods. Not spectacular growth but not an implosion. The status quo seems to be the message. This doesn't imply a lot of growth, yet also doesn't imply a contraction. Bottom line it is too early to say how the second quarter is shaping up, yet at least this report didn't give yet another economic grenade lobbed into Wall Street's party.
What is a durable good? It's stuff manufactured that's supposed to last at least 3 years. Here are our durable goods, related overviews, only some graphs revised. The durable goods advance report is often revised when the full factory orders statistics are released. The report excludes semiconductor manufacturing and we must wonder if that means it is non-existent since so much has been offshore outsourced and thus corporations don't want the public to figure that fact out.
Recent comments