
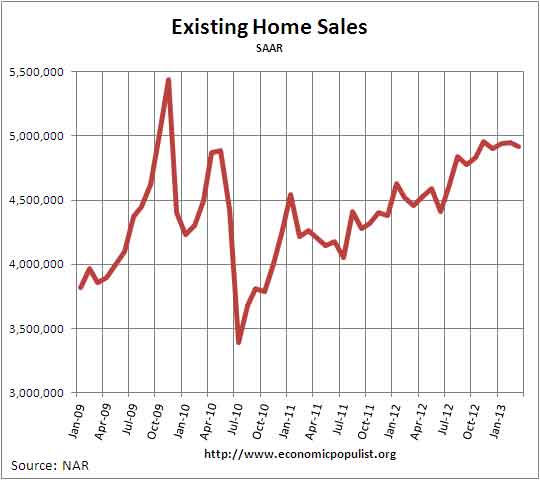
NAR reported their March 2013 Existing Home Sales. Existing home sales decreased -0.6% from last month and inventories increased to a still very tight 4.7 months of supply. Existing homes sales have increased 10.3% from a year ago. Volume was 4.92 million against February's 4.95 million, annualized existing home sales. NAR blames inventories yet volume for February was revised downward from 4.98 million.
Inventory of existing homes increased 2.2% for the month, a 4.7 months supply and inventory is down -24.2% from a year ago. Inventories by months to sell at current sales volume is now at 2005 levels. Short supply also partially explains the increasing prices. NAR blames inventories yet last month inventories were lower. NAR claims buyer traffic has increased 25% from a year ago.
The national median existing home sales price, all types, is up, now at $184,300, a 11.8% increase from a year ago. This is the highest annual increase since November 2005. Even more eerie, the last time there were 13 consecutive months of median existing home price increases was also the height of the housing bubble, May 2005 through May 2006. The average home price for March was $233,200, a 9.9% annual increase. We have bubble like price increases that may very well have much to do with the Federal Reserve mortgage backed securities purchases, known as quantitative easing. The Fed's move is keeping mortgage interest rates at record lows. Yet NAR never mentions homes becoming unaffordable as a reason this month's sales declined.
According to RealtyTrac, foreclosures are down to Q2 2007 levels, but foreclosure starts increased 2% for the month.
Foreclosure filings — default notices, scheduled auctions and bank repossessions — were reported on 152,500 U.S. properties in March, a decrease of 1 percent from the previous month and down 23 percent from March 2012.
The decrease in March helped drop first quarter foreclosure numbers to the lowest level since the second quarter of 2007. Foreclosure filings were reported on 442,117 U.S. properties in the first quarter, down 12 percent from the previous quarter and down 23 percent from the first quarter of 2012. .
U.S. foreclosure starts increased 2 percent from February to March, the second straight monthly increase following three consecutive monthly decreases. There were a total of 73,113 foreclosure starts nationwide in March, still down 28 percent from a year ago.
Below is NAR's breakdown by types of existing home sales by time and distressed property sales have significantly decreased.
Distressed homes4 - foreclosures and short sales - accounted for 21 percent of March sales, down from 25 percent in February and 29 percent in March 2012. Thirteen percent of March sales were foreclosures, and 8 percent were short sales. Foreclosures sold for an average discount of 15 percent below market value in March, while short sales were discounted 13 percent.
There are still a significant percentage of all cash buyers, institutional investors buying homes. First time home buyers stood at 30% of existing home sales.
All-cash sales were at 30 percent of transactions in March, down from 32 percent in February; they were 32 percent in March 2012. Individual investors, who account for most cash sales, purchased 19 percent of homes in March, down from 22 percent in February; they were 21 percent in March 2012..
According to NAR, 37% of existing homes were on the market less than a month before being sold.
The median time on market for all homes was 62 days in March, down from 74 days in February and is 32 percent below 91 days in March 2012. Short sales were on the market for a median of 81 days, while foreclosures typically sold in 46 days and non-distressed homes took 66 days.
Here is our overview of last month's existing home sales not revised. NAR does not mention their revisions in their press releases.
Recent comments