
The Federal Reserve's Industrial Production & Capacity Utilization report, G.17, shows 1.1% increase in industrial production for April 2012. Manufacturing increased 0.6%, mining 1.6% and utilities increased their production a whopping 4.5% in a course of a month. The April jump in utilities shows just how unusual the January to March warm weather was. Within manufacturing, motor vehicles & parts alone also increased an astounding 3.9% for April. March industrial production was revised down, from no change to -0.6% and February was revised to now show a monthly increase of +0.4%. This report is also known as output for factories and mines.

This is the largest monthly percentage industrial production increase since December 2010.
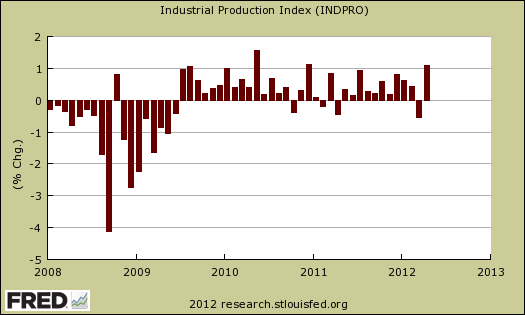
While total industrial production has increased 5.2% from April 2011, the index is still down 2.6% from 2007 levels, which is amazing since this is April 2012. Here are the major industry groups yearly industrial production percentage changes from a year ago.
- Manufacturing: +5.8%
- Mining: +4.9%
- Utilities: +1.1%
Below is the Fed's description of Market groups from the report and their monthly percent changes. The report also gives annualized rates and bear in mind these are much higher than monthly percentage changes by their nature.
The production of consumer goods increased 0.8 percent in April. The index for durable consumer goods rose 1.9 percent, led by a gain of 2.4 percent in automotive products. All other major categories of consumer durables posted gains of more than 1 percent. The production of nondurable consumer goods moved up 0.5 percent as a result of an increase of 2.5 percent in the index for consumer energy products. The output of non-energy nondurable consumer goods edged down 0.1 percent as a small gain in chemical products was more than offset by a decrease in foods and tobacco.
The production of business equipment moved up 1.5 percent in April after having risen 0.2 percent in March. The more rapid gain in April reflected improvement for all of the major business equipment categories, particularly transit equipment, which posted an increase of more than 3 percent for the third month this year.
The index for defense and space equipment rose 0.3 percent in April and was up 5.0 percent over the past 12 months.
The production of construction supplies was unchanged in April after falling 1.6 percent in March; it remained more than 20 percent below its level preceding the recession. The index for business supplies advanced 1.4 percent for its largest increase in more than 2 years.
The output of materials to be further processed in the industrial sector rose 1.3 percent in April. The index for durable materials increased 1.0 percent after having decreased 0.5 percent in March; growth in this category averaged 1.4 percent per month for November through February. Much of the increase in durable materials in April came from consumer parts, which advanced 2.7 percent and was boosted by an increase in the output of motor vehicle parts for use in newly assembled vehicles. The production of equipment parts moved up 1.3 percent, and the index for other durable materials rose 0.3 percent. The production of nondurable materials increased 0.3 percent, as all of its subcategories posted gains. The output index for energy materials jumped 2.2 percent after four straight months of declines.
The breakdown of manufacturing's 0.6% monthly production increase was primarily durable goods, which increased 1.3%. Wood products dropped -1.4% while motor vehicles and parts jumped +3.9%. Computer and electronics increased 1.6% while furniture came alive with a 2.4% monthly percentage change.
Nondurable goods dropped -0.2% with coal and petroleum production nose diving -2.6% for the month. Yeah, that's right, let's keep those gas prices sky high people. Below is a graph of just the manufacturing index, part of industrial production.

Below is another graph of industrial production since September 1990, indexed to that month. Look at the slope, the growth through the 1990's and then compare to 2000 decade. It was in 2000 when the China trade agreement kicked in and labor arbitrage of engineers, advanced R&D, I.T., STEM started in earnest.

Capacity utilization, or of raw capacity, how much is being used, for total industry is now 79.2%, 1.1 percentage points below the average from 1972 to 2011, 80.3%. Capacity utilization has increased 3.1% from April 2011. For manufacturing capacity utilization increased +0.3 percentage points for the month. But at 77.9%, manufacturing capacity is still 0.9 percentage points below it's long term average. On the other hand, manufacturing capacity utilization has increased 14.1 percentage points from June 2009. This shows just how bad the recession slaughter was for manufacturing.
Capacity utilization is how much can we make vs. how much are we currently using, of what capacity is available now. Capacity utilization is industrial production divided by raw capacity.

Capacity growth is not to be confused what what is being utilized, instead this is the actual growth or potential to product. Capacity growth overall has increased only 1.0 percentage points from April 2011. Below is the capacity growth increase from a year ago.
- Manufacturing: +0.8%
- Mining: +1.9%
- Utilities: +2.4%
According to the report, manufacturing uses 77% of capacity, utilities 10.3% and mining 12.8% in 2011 (rounded) to give a ratio of manufacturing vs. mining and utilities.
Below is the Manufacturing capacity utilization graph, normalized to 2007 raw capacity levels, going back to the 1990's. Too often the focus is on the monthly percent change, so it's important to compare capacity utilization to pre-recession levels and also when the economy was more humming.

Capacity, on the other hand, is the overall level of plants, production facilities, and ability to make stuff, that we currently have in the United States. Think about a new factory being built, or a factory shut down and it's machinery sold at auction and shipped to China. This is capacity.
The Federal Reserve releases detailed tables for more data, metrics not mentioned in this overview.
If you are baffled by what crude, finished mean from the G.17 report, read these stages of production definitions. Stages of production have implications for exports, further industrial production for finishing and since only finished goods are for final sale, what kind of output one will see for the month.
Here is our industrial production report overview from last month, unrevised.
Recent comments