
The Federal Reserve Industrial Production & Capacity Utilization report declined -0.6% in March. Worse, this is the second month in a row for a -0.6% decline. More ominous is a first quarter annualized -2.2% contraction. Mining by itself had the biggest monthly decline since September 2008. It is not just energy production that is the culprit dragging down industrial production. Manufacturing factory output also declined in March. The G.17 industrial production statistical release is also known as output for factories and mines.
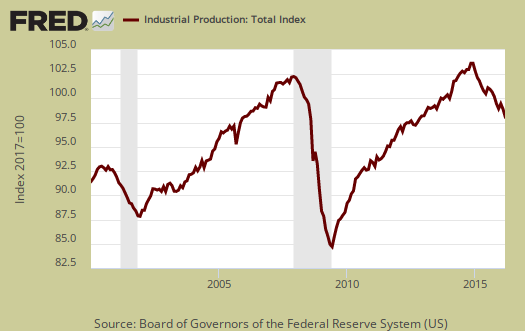
Total industrial production has now decreased -2.0% from a year ago. Currently industrial production is now 3.4 percentage points above the 2012 average. Below is graph of overall industrial production's percent change from a year ago. Notice the grey recession bars in the FRED graph and how closely industrial production follows those bars.

Here are the major industry groups industrial production percentage changes from a year ago. The percentages for mining and utilities are now just horrific.
- Manufacturing: +0.4%
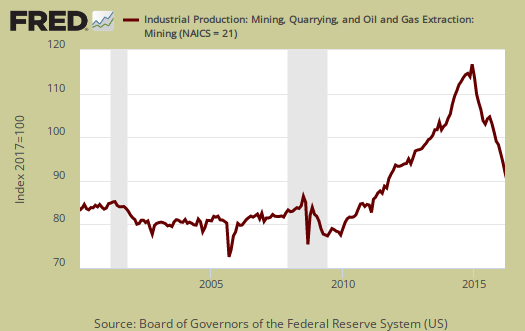
- Mining: -12.9%
- Utilities: -7.7%
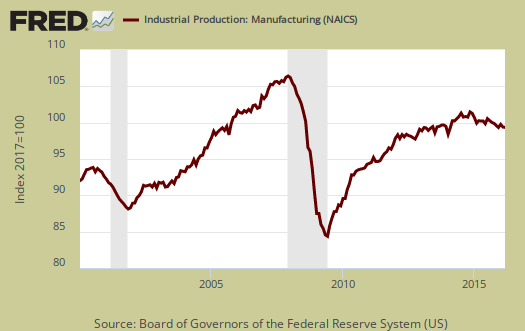
For the month manufacturing overall declined by -0.3%. For the first quarter of 2016, manufacturing output is an annualized 0.6%, which in essence erases it's Q4 2015 decrease. Manufacturing output is 3.1 percentage points above its 2012 Levels and is shown in the below graph.
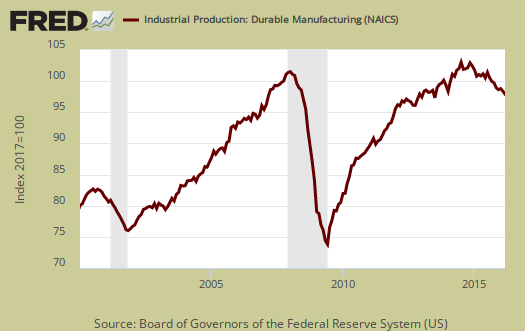
Within manufacturing, durable goods had a -0.4% monthly decline. Motor vehicles dropped -2.8% for the month.
Nondurable goods manufacturing declined by -0.1 percentage points for the month with across the board decreases. Strangely oil and coal products increased 1.0%.

Mining decreased -2.9% and is now down -12.9% for the year. This is the largest drop since September 2008 but the reason for that 2008 drop was hurricanes, so this is worse since there is no environmental event. For the past seven months, mining production has declined by an average of -1.6% per month. Mining includes gas and electricity production and the Fed have a special aggregate index for oil and gas well drilling. Oil and gas well drilling decreased -8.5% for the month and for the year is down -55.4%. Coal by itself declined by -12.2% for the month.
Below is oil and gas well drilling and one can see the boom and bust cycle with the amazing downturn now.

Utilities decreased by -1.2% for the month on warm weather and is down -7.7% for the year. Utilities are volatile due to weather and why the below graph shows the wild swings.

There are two reporting methodologies in the industrial production statistical release, market groups and industry groups. Market groups is output bundled together by market categories, such as business equipment or consumer goods and shown below:
Most major market groups recorded declines in March. The output of consumer goods decreased 0.4 percent: The indexes for durables and for consumer energy products each fell about 1 percent, while the output of non-energy nondurables edged down. Among durable goods, decreases for automotive products and for miscellaneous goods were slightly offset by gains for home electronics and for appliances, furniture, and carpeting. The decline for consumer energy products reflected the drop in utilities; however, the output of consumer fuels rose. The production of business equipment moved down 0.4 percent because of decreases in the indexes for transit equipment and for industrial and other equipment. The output of defense and space equipment moved up 0.4 percent. The indexes for construction supplies and business supplies declined 1.2 and 0.5 percent, respectively. The output of materials fell 0.8 percent, primarily as a result of a decrease for energy materials. For the first quarter, the output of consumer goods rose despite a drop in consumer energy products, but the indexes for most other major market groups decreased.
Capacity utilization, or of raw capacity, how much is being used, for total industry is 74.8%, an decrease of -0.5 percentage points from last month. . Capacity utilization has decreased by -1.5 percentage points from a year ago and is 5.2 percentage points below the long run average. This is really a terrible sign as utilization just continues to shrink. Manufacturing capacity utilization declined -0.3 percentage points for the month, is 75.1% and is 3.4 percentage points below it's long run average. Mining capacity utilization is 73.7% and has declined 12.3 percentage points from just a year ago. Utilities use of it's capacity is 73.7%. Both mining capacity utilization and utility utilization are at the lowest point ever that the Federal Reserve has tracked on this metric. That's a whopping historical bad sign.
Capacity utilization is how much can we make vs. how much are we currently using, of what capacity is available now, or output rate. Capacity utilization is also called the operating rate. Capacity utilization is industrial production divided by raw capacity.

Capacity growth is raw capacity and not to be confused what what is being utilized. Instead, this is the actual growth or potential to produce. Capacity is the overall level of plants, production facilities, and ability to make stuff, that we currently have in the United States. Capacity growth overall has increased 1.2 percentage points from a year ago. Below is the capacity growth increase from a year ago of the subcategories which make up industrial production.
- Manufacturing: +0.8%
- Mining: +1.6%
- Utilities: +0.6%
Below is the Manufacturing capacity utilization graph, normalized to 2007 raw capacity levels, going back to the 1990's. Pay particular attention to the 2001-2003 time frame as manufacturing had a mass exodus to China after passage of the bad trade deal in 2000.

This report is really horrific and bodes poorly for Q1 GDP. Industrial production has declined for 6 of the past 7 months. We believe many analysts will blow off this report and claim industrial production will pick up. We're not so sure due to the historical lows in capacity utilization. Those figures do not look like a minor bump in the road. Here are our previous overviews, only graphs revised. The Federal Reserve releases detailed tables for more data, metrics not mentioned in this overview.
Recent comments