
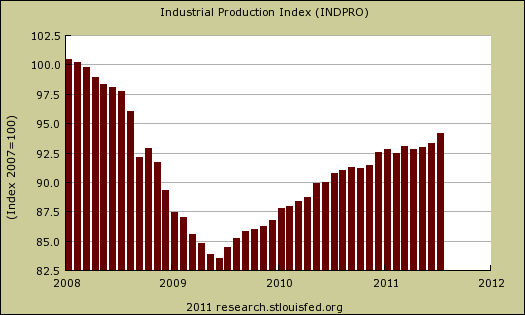
The Federal Reserve's Factory Production report shows a 0.9% increase for July 2011 Industrial Production, otherwise known as output for factories and mines. June, May and April were all revised, +0.4%, +0.2% and -0.3% respectively. June's revision is a +0.2 percentage point increase. To sum up a conclusion on this month's statistics: reports of America's economic death are greatly exaggerated. Here is the Federal Reserve's detailed report.
The heat dome maybe torturing the country but it helped utilities jump 2.8% in a month. Autos had a good month, up 5.2%.
Manufacturing output rose 0.6 percent in July, as the index for motor vehicles and parts jumped 5.2 percent and production elsewhere moved up 0.3 percent. The output of mines advanced 1.1 percent, and the output of utilities increased 2.8 percent, as the extreme heat during the month boosted air conditioning usage.

Total Industrial production is still down -5.8% from pre-recession levels, in other words going on 4 years, even while up 2.2% from July 2010. The Fed also reports industrial output is -2.9% below the entire 1972-2010 average.
Here are the major industry groups yearly industrial production percentage changes. Utilities does have this summer's heat dome effect included. None too good for extreme heat to be a factor in boosting output.
- Manufacturing: +3.8%
- Mining: +6.6%
- Utilities: -0.2%
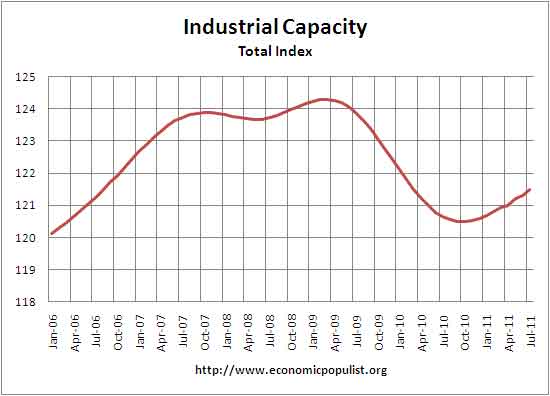
Below is the graph of raw capacity, indexed against 2007 output. This is just how much capacity does the U.S. have to make stuff. Look at how total capacity has declined for the first time in the historical data. This index represents the raw facilities, potential to make stuff. Raw capacity is the underlying number by which utilization is calculated. This month capacity increased +0.2. We are back on the rise, but still below pre-recession levels.
Below is the Fed's description of Market groups from the report and their monthly percent changes.
Production increased for all of the major market groups in July. The output of consumer goods advanced 1.1 percent; even so, it was only 1.3 percent above its year-earlier level. Consumer durables recorded a gain of 3.6 percent. Automotive products posted a jump of 5.9 percent to lead the increase in durables, as motor vehicle output rebounded after the supply chain disruptions that resulted from the earthquake in Japan. Output also increased for the other major components of durable goods, with gains of nearly 1 percent or more in both home electronics and miscellaneous goods. The output of nondurable consumer goods rose 0.5 percent. Most of the increase of 1.5 percent in consumer energy products reflected the jump in utility output. The production of other nondurables edged up 0.1 percent, as a gain in foods and tobacco was mostly offset by decreases in clothing and chemical products.
The production of business equipment increased 0.6 percent in July and has gained 8.5 percent in the past 12 months. All of the major components of business equipment are substantially above their levels of a year earlier. In July, the indexes for information processing equipment and transit equipment rose 1.0 percent and 2.5 percent, respectively, while the index for industrial and other equipment decreased 0.4 percent.
In July, the index for defense and space equipment increased 0.6 percent after having fallen 1.1 percent in June. Production for this market group has advanced, on net, since the end of last year, though at a slower pace than during 2010.
The output of construction supplies increased 0.3 percent in July, its second small monthly gain following a large jump in May. Over the past 12 months, the index for construction supplies has moved up 4.4 percent; nevertheless, the index in July remained more than 20 percent below its average level during 2007. The production of business supplies gained 0.8 percent in July; even so, it has increased only 1.3 percent during the past 12 months and has reversed little of the decline from late 2007 to early 2009.
The production of materials to be further processed in the industrial sector rose 0.9 percent in July. The output of durable materials increased 0.7 percent and was up for a third consecutive month. Consumer parts recorded an increase of 1.0 percent in July after having moved up 2.8 percent in June. The output of equipment parts declined 0.2 percent after gains in May and June of 1.3 percent and 1.0 percent, respectively; the production of equipment parts has advanced 10.6 percent in the past 12 months. The output of nondurable materials edged up 0.1 percent in July. Although the indexes for both textile and paper materials increased about 3/4 percent, the output of chemical materials only edged up, and the output of other nondurable materials fell. The output of energy materials rose 1.6 percent, with advances in the extraction of both natural gas and crude oil accompanied by an increase in the output of utilities.
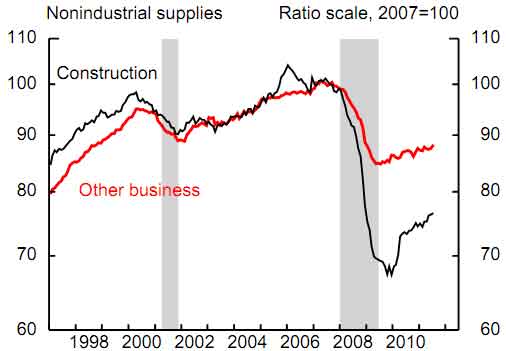
Below is the industrial production graph for construction, in black, and we can see this entire sector has been decimated.
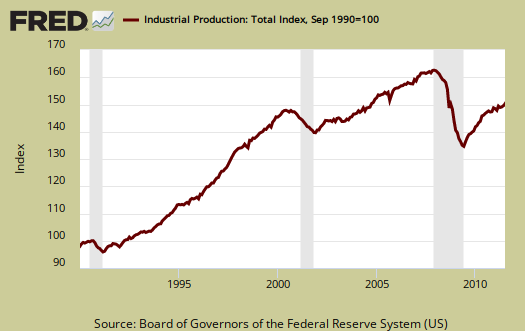
Below is another graph of industrial production since September 1990, indexed to that month. Look at the slope, the growth through the 1990's and then compare to 2000 decade. It was in 2000 when the China trade agreement kicked in and labor arbitrage of engineers, advanced R&D, I.T., STEM started in earnest.
Capacity utilization, or of raw capacity, how much is being used, for total industry is now 77.5%, up +0.6 percentage points from last month. But the Fed notes this is -2.9 percentage points below the average from 1972 to 2010, 80.4%. Capacity utilization has increased 2.2 percentage points from June 2010.
Below are capacity utilization's monthly percentage point change.
- manufacturing: +0.4%
- mining: +0.8%
- utilities: +2.2%
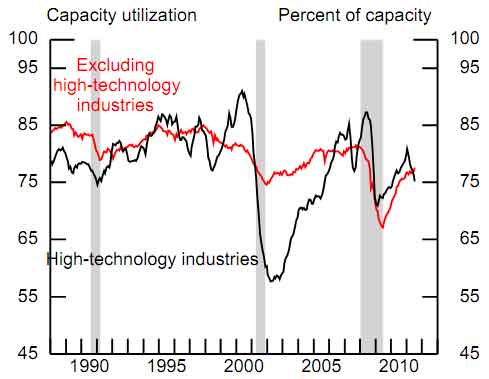
- selected high-technology industries: -0.1%
- crude: +0.6%
- primary: +0.7%
- finished: +1.2%
Capacity utilization is how much can we make vs. how much are we currently using and this month shows signs of life, although the U.S. is still not producing what it is capable of, a reflection of the output gap. Note, this index is normalized to a specific year, currently from most reports, the 2007 yearly average (see year in the graph). Therefore, one cannot take absolute values of capacity utilization, i.e. 80%, and claim this is an indicator of a healthy economy, for it all depends on what year capacity utilization is normalized to. One can take the slope, or rate of change from the peak of a recession and determine recovery, but again, these percentages are relative, they are not absolute ratios to a static point in time. Also recall utilization is a percentage of real total capacity. Notice that total capacity in the United States has declined.
According to the report, manufacturing uses 77.8% of capacity, utilities 10.4% and mining 11.8%.

Below is the Manufacturing capacity utilization graph, normalized to 2007 raw capacity levels, going back to the 1990's. Too often the focus is on the monthly percent change, so it's important to compare capacity utilization to pre-recession levels and also when the economy was more humming.

One of the more interesting graphs is high tech capacity utilization, and industrial production a special aggregate, shown below. While industrial production is up 8.3% for the year, communications equipment dropped -0.4% for July and is up only 0.8% for the year. These high tech sectors seems to correlate to when the high tech industry offshore outsourced in droves to China and communications equipment is one area that is being offshore outsourced.. Capacity utilization keeps dropping and this month was another -0.9%.
If you are baffled by what crude, finished mean, read these stages of production definitions.
The Federal Reserve releases detailed tables for more data, metrics not mentioned in this overview.
Last month's overview, the original report, not revised, although the graphs are updated with revisions, is here.
How Will June's Revisions affect Q2 GDP?
The BEA defines the relationship between GDP and the Industrial Production index:
So, with that, while business inventories and trade implied significant downward revisions to Q2 GDP, this revision, basically a doubling of IP for June, implies a slight upward one.
For the quarter, IP was revised up 0.3 percentage points. Assuredly that will reflect an upward revision in GDP.
How much, I haven't gotten to that level of relationships (and I think I'd be paid a hell of a lot more money if I had my own 100% thorough GDP estimation algorithm!), but I don't think it will be 0.7% revision like I earlier implied, maybe more hovering around 1%. (which is good).