
Leading indicators down 0.7% according to the conference board. There are ten indicators in this calculation.
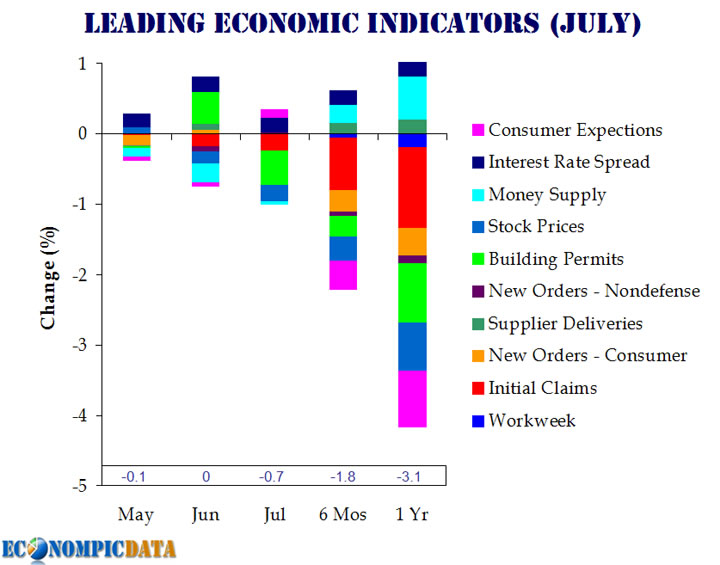
Three of the ten indicators that make up the leading index increased in July. The positive contributors — beginning with the largest positive contributor — were the interest rate spread, index of consumer expectations, and manufacturers' new orders for nondefense capital goods*. The negative contributors — beginning with the largest negative contributor — were building permits, stock prices, average weekly initial claims for unemployment insurance (inverted), real money supply*, and manufacturers' new orders for consumer goods and materials*. Average weekly manufacturing hours and the index of supplier deliveries (vendor performance) held steady in July. The leading index now stands at 101.2 (2004=100). Based on revised data, this index remained unchanged in June and decreased 0.1 percent in May. During the six-month span through July, the leading index decreased 0.9 percent, with three out of ten components advancing (diffusion index, six-month span equals 30 percent
The EconompicData blog made a pretty picture of these stats:
click graph to enlarge
Here is the Conference Board (pdf) of the details. This is a privatized index which if anyone else has any more information on, please leave a comment.
Economic indicators are kind of one of those things where there might be a disconnect between main street and Wall Street.
Recent comments