
Earlier we reviewed the March 2011 BLS unemployment report. This post goes into a more unemployment and jobs details not covered previously.
There are 13,542,000 people officially unemployed, and if one takes the alternative measure of unemployment, it's over 24 million.
Below is a new graph, courtesy of the Saint Louis Federal Reserve, for the unemployment rate of just those unemployed 15 weeks or longer. 60.1% of the people who are officially counted as unemployed have been so 15 weeks or longer. The number of people unemployed 15 weeks or longer as part of the civilian labor force is 5.3%. Compare this to the official 8.8% unemployment rate. This means that it takes most people who are unemployed almost 4 months or more to find a job...if they do.

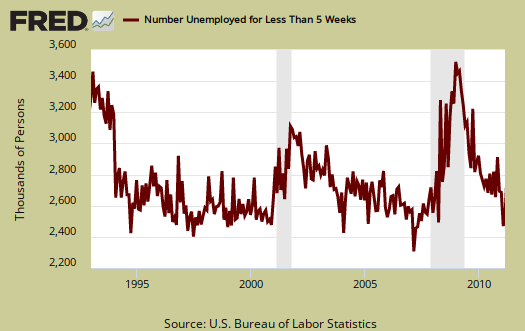
There are 59,000 more people who are unemployed for less than 5 weeks in March. People out of work 5 to 14 weeks dropped -180,000 and 15 to 26 weeks unemployed also dropped -222,000. Below is the graph of those unemployed for less than 5 weeks. Notice a clear downward trend and a return to pre-recession levels. In spite of everyone in America being fired by now, the fact those newly unemployed is staying reasonably lower is better news. This fact does not discount the fact the United States still has a job crisis, but let's take good news where we can find it.
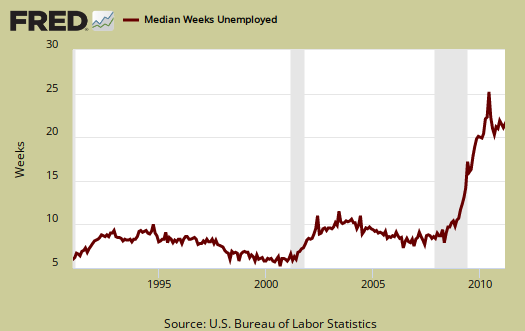
The below graph is the median time for being unemployed over the last 20 years. Look at the pathetic dramatic increase. That means there is overall lost income by being out of work longer and we haven't even discussed how the new jobs are paying way less and most of the jobs being created are low paying jobs.
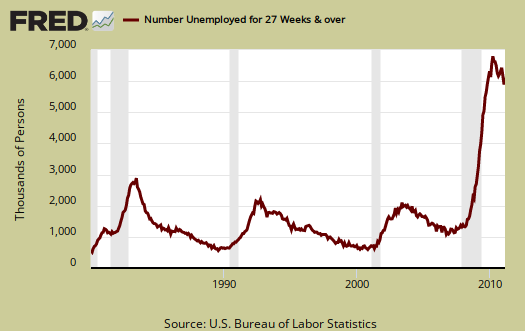
The long term unemployed (> 27 weeks) increased by 129,000 in March. The problem with this number is we do not know the percentage of those who plain fell off the count and didn't get a job. 45,5% of the official unemployed have been so for 27 weeks or longer. Those employers refusing to give a job to someone who needs a job, refusing to hire someone unemployed....should be sued for discrimination in my opinion.
- Long term unemployed - 5.993 million
- Forced Part Time - 8.433 million
- Marginally attached to the labor force - 2.434 million
Of the Marginally attached, 921 million are discouraged. Forced part-time increased 93,000 this month, yet those reporting the reason is slack business conditions dropped -35,00 and the worker could only get part-time also dropped -83,000 in March. The marginally attached, or those not counted but really wanting a job, decreased -296,000, but this number is not seasonally adjusted. These 2.43 million marginally attached are not counted in the official unemployment rate, but you can be guaranteed they do need a job.
U6, defined as total unemployed, plus all persons marginally attached to the labor force, plus total employed part time for economic reasons, as a percent of the civilian labor force plus all persons marginally attached to the labor force, (table A.15), was 15.7%.
One of the most telling signs that people have dropped out of the count is the increase of those not in the labor force. For the year, the number has increased from 83,499,000 to 85,977,000. It's doubtful that people retiring increased by 2.5 million in the last year.
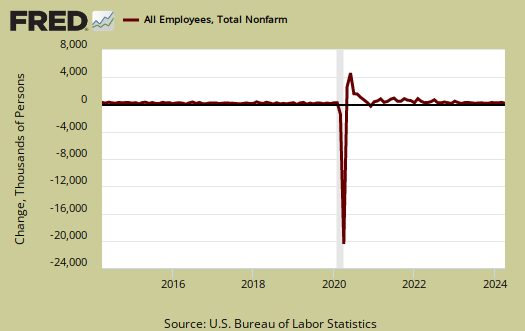
To even get back to pre-recession unemployment rate levels we need a good 424,000 jobs created each month. That's permanent jobs. Even if the U.S. created 400,000 permanent jobs each month, it would take over 18 months to recover the jobs lost since December 2007, the start of the great recession, or 7.245 million jobs. If one created 400,000 jobs per month, to get to the start of the great recession unemployment rate of 5%, or roughly 10.5 million jobs, it would take over 26 months, or over 2 years to recover. Below is the seasonally adjusted monthly change in the number of payroll jobs in the U.S. See a lot of over 400,000 monthly increases in the past decade?
In looking over table B1 we can get a little more detail on what kind of jobs were created (and lost) on the permanent jobs front.
- Financial: +6,000
- Information: -4,000
- Construction: -1,000
- Manufacturing: +17,000
- Durable: +17,000
- Mining & Logging: +15,000
- Health and Education: +45,000
- Leisure and Hospitality: +37,000
- Professional & Business Services: +78,000
- Temporary: +28,800
- Accounting & Bookkeeping: +20,200
- Administrative & Waste services: +42,000
- Trade, Transportation, Utilities: +32,000
- Retail Trade: +17,700
- Government: -14,000
- Local Government: -15,000
While for some reason public or government workers are under assault, local government employees are clearly hurting. There has been 416,000 local government jobs lost since September 2008.
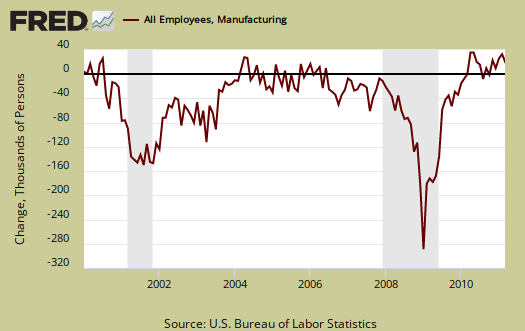
Below is the graph of the monthly change in manufacturing payroll jobs, seasonally adjusted, against the ISM Manufacturing Employment Index, which dropped -1.5 percentage points for March. If one recalls the February ISM report had as blow out on U.S. manufacturing employment. Also, it appears the ISM index doesn't capture the overall decline in manufacturing jobs over time. Hi Ho, Hi Ho, offshore outsourcing to China they go, that's the bottom line.
Bear in mind illegal workers and foreign guest workers are counted as employed Americans, which can distort occupational sectors, particularly the Engineering, I.T., Science and Technology ones. Below are the unemployment rates per occupational sector from table A-14, not seasonally adjusted.
- Financial: 7.1%
- Information: 7.6%
- Construction: 20.0%
- Manufacturing: 9.7%
- Transportation, Utilities: 9.6%
- Mining & Gas, Oil: 5.9%
- Health and Education: 5.3%
- Leisure and Hospitality: 13.2%
- Professional & Business Services: 10.0%
- Retail, Wholesale Trade: 8.8%
- "Other" Services: 8.1%
- Government: 4.0%
- Agricultural: 14.5%
- Self-employed, unpaid family: 5.3%
Probably the most horrific not seasonally adjusted unemployment rate is the 10.0% for Professional and Business Services unemployment rate. This occupation category implies a college degree. This particular area is fraught with foreign guest worker Visas, which distorts the real occupational unemployment rate. If an American is displaced by a foreign guest worker, then is forced to take a job at Walmart, that person is no longer categorized as a Chemical Engineering PhD out of work, but instead as a retail trade worker.
The above numbers are not seasonally adjusted so part of the agricultural and construction rates are due to the seasons, that said, construction unemployment has been decimated anyway you look at it.
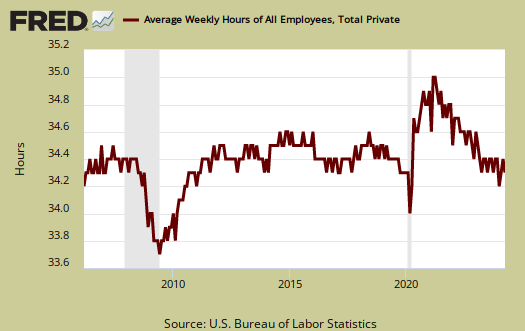
The average work week remained the same, 34.3 hours. Average earnings for the private sector (drum roll please), was unchanged, $22.87/hr. Yet the worker bees, or non-supervisory jobs average pay dropped 2¢ to $19.30/hr. Take a look at how many industry sections are below full time hours. Is a common practice among employers to keep workers part-time, in order to deny them full-time benefits.
You probably also want to know the birth/death model. What is that? It's a statistical adjustment to compensate for new businesses and dead businesses who are not actually tallied by data reports. Those jobs created and died outside the statistical reporting time window due to lag. So, the BLS estimates how many jobs can be attributed to those firms which are not actually counted. This month's adjustment was +117,000 jobs. One cannot directly subtract the birth/deal model monthly numbers, because unemployment data is seasonally adjusted, yet the birth/death adjustment is not seasonally adjusted, get that? Anywho, jobs attributed to new and dead businesses are just an estimate in so many words. Not seasonally adjusted, payrolls added 925,000 jobs, as an example of why one cannot apply the birth/death model to seasonally adjusted data.
Robert, Nice drill-down, but
Robert,
Nice drill-down, but your last comment leaves me puzzled. Can you explain how you arrive at 925,000 payrolls added from the data provided?
Also, are you saying that real job growth was under 100,000 because the birth death model added jobs did not exist?
Thanks
that number is not seasonally adjusted
employment, especially, swings wildly, so statisticians use seasonal adjustments.
The birth/death model is not seasonally adjusted, it's added before that adjustment is done.
So, my point here is that not seasonally adjusted, payroll job increases were actually 925,000 and I got that number straight from the BLS, you can access their NSA, or not seasonally adjusted data.
My point here is you cannot add and subtract NSA data from SA data because it's statistically invalid.
So, you cannot subtract off the birth/death jobs added to the 216,000 for that is mixing seasonally adjusted payroll to the not seasonally adjusted birth/death model jobs.
You'd have to use the NSA or not seasonally adjusted payroll number, which is 925,000, subtract off the birth/death model of 117,000 to get to 808,000 payroll jobs
but then apply the seasonal adjustment model, which is called X-12, to get the real seasonal adjustment without the birth/death model guesstimate.
I frankly suspect the birth/death model overstates jobs and a good reason why is the use of past events to predict futures ones, in statistics.
i.e. if 50 people cross the road at 11am every Saturday for 20 years, it's a good bet that 50 people will cross the road next Saturday...
but if you do not take into account that 50 people were just relocated to China because walking there is "cheaper" (read corporate herd behavior), then your prediction for next Saturday will be overstated.
There is a great Atlanta Fed post, click here for it, overviewing new reports showing a slow down of new businesses and especially the employment growth rates of new businesses past 2008.
Going through BLS reports is truly an exercise in Where's Waldo.
One thing that really bothers me is how accurate is the monthly change in civilian, non-institutional population. All things are derived from that number.