
The NAR released their May 2012 Existing Home Sales report last Thursday.
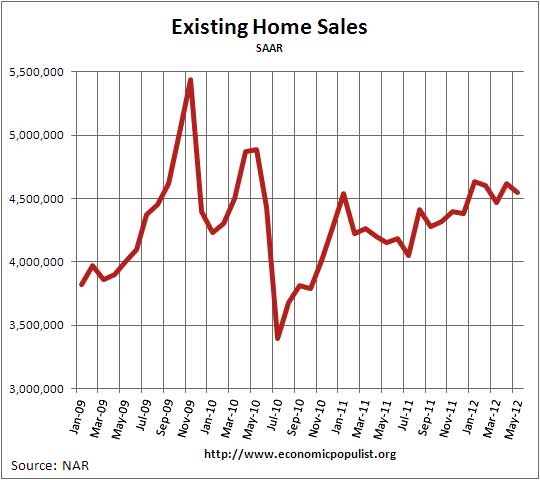
Total existing-home sales, which are completed transactions that include single-family homes, townhomes, condominiums and co-ops, declined 1.5 percent to a seasonally adjusted annual rate of 4.55 million in May from 4.62 million in April, but are 9.6 percent above the 4.15 million-unit pace in May 2011.
Believe it or not, NAR claims the slight decline in existing home sales to a lack of inventory, yet they blame the decline more on cheap inventory, in other words, foreclosures and short sales. Here are the quoted inventory statistics:
Total housing inventory at the end of May slipped 0.4 percent to 2.49 million existing homes available for sale, which represents a 6.6-month supply at the current sales pace; there was a 6.5-month supply in April. Listed inventory is 20.4 percent below a year ago when there was a 9.1-month supply. Unsold inventory has trended down from a record 4.04 million in July 2007; supplies reached a cyclical peak of 12.1 months in July 2010.
Here we can see it is possible there were less foreclosures for sale, or is it simply a lack of buyers?
Distressed homes - foreclosures and short sales sold at deep discounts - accounted for 25 percent of May sales (15 percent were foreclosures and 10 percent were short sales), down from 28 percent in April and 31 percent in May 2011. Foreclosures sold for an average discount of 19 percent below market value in May, while short sales were discounted 14 percent.
Notice in the below paragraph the decline in all cash buyers and investor buyers.
All-cash sales slipped to 28 percent of transactions in May from 29 percent in April; they were 30 percent in May 2011. Investors, who account for the bulk of cash sales, purchased 17 percent of homes in May, down from 20 percent in April and 19 percent in May 2011.
The median sales price for existing homes is now $182,600 and up 7.9% from a year ago. The median price can also be pushed up by less low end foreclose sales.
Foreclosures and short sales were 25% of May existing home sales down from April's 28%. The breakdown was 15% were foreclosure sales and 10% were short sales. Foreclosures sold 19% below market value, short sales were 14%. Cash buyers were 29% of all sales with investors being 20% of those cash sales. First time home buyers were 35% of all sales.
Calculated Risk has some commentary on existing home sales inventory.
Important: The NAR reports active listings, and although there is some variability across the country in what is considered active, most "contingent short sales" are not included. "Contingent short sales" are strange listings since the listings were frequently NEVER on the market (they were listed as contingent), and they hang around for a long time - they are probably more closely related to shadow inventory than active inventory. However when we compare inventory to 2005, we need to remember there were no "short sale contingent" listings in 2005. In the areas I track, the number of "short sale contingent" listings is also down sharply year-over-year.
Finally we have a graph on existing home sales to foreigners, up 25% from one year ago and more than double from 5 years ago.

The reason we are overviewing May existing home sales so late is because this week is housing statistics week. We want to present all of the housing statistics as they are released to get a clear picture.
Last month's existing home sales overview is here.
Recent comments