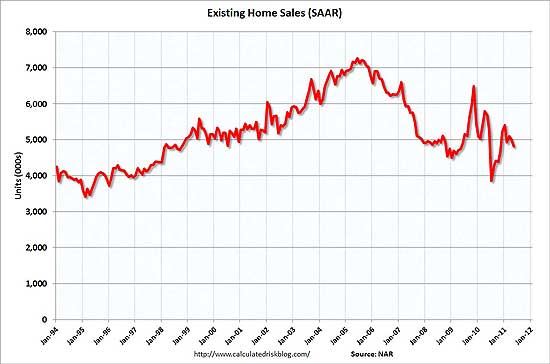
The National Association of Realtors released their existing home sales figures and give an May decrease of 3.8%, annualized rate, from April. Existing home sales are now 15.3% below what they were one year ago.

Existing-home sales, which are completed transactions that include single-family, townhomes, condominiums and co-ops, fell 3.8 percent to a seasonally adjusted annual rate of 4.81 million in May from a downwardly revised 5.00 million in April, and are 15.3 percent below a 5.68 million pace in May 2010 when sales were surging to beat the deadline for the home buyer tax credit.
NAR blames part of the slow down on people's inability to obtain a mortgage, so magically for those left with any bucks. Yet, they magically don't mention how people are out of money, they lost their jobs, the future is bleak, retirements also wiped out. They also love to promote tax credits.
Distressed homes sales were 31%, down from the April record of 37% for all existing home purchases. NAR reports investors are most of these cash sales. The NAR typical discount claimed is 20% for distressed sales.
The median price of all existing home sales is $166,500, a 4.6% drop from one year ago, but up from April.
This means people are picking up foreclosures, short sales at so called bargain prices.
NAR claims this report might be a bottom in existing home sales prices:
The price decline could be diminishing, as buyers recognize great bargain prices and the highest affordability conditions in 40 years; this will help mitigate further price drops
Yet considering NAR's refusal to acknowledge income and the never ending attack on the U.S. middle class, I don't see how a bottom call is possible. Median home prices are still much higher than what wages imply families can afford. They even note the relationship:
Home prices are rising or very stable in local markets with improved employment conditions, such as in North Dakota, Alaska, Washington, D.C., and many parts of Texas.
Looks like wishful thinking on the part of NAR that the jobs crisis will dissipate anytime soon.
Housing inventory increased to a 9.3 month supply and is up 9.9% for the month. For the year, existing inventory is down 4.3% as calculated by Calculated Risk.
The graph was courtesy of Calculated Risk, the best blog out there for original, independent, detailed, real estate graphs, data and analysis.

Recent comments