In April, New Residential Single Family Home Sales increased by 3.3%, or 343,000 annualized sales. This report has a ±12.3% error margin.
New single family home sales are now 9.9% above April 2011 levels. A year ago new home sales were 312,000. Sales figures are annualized and represent what the yearly volume would be if just that month's rate were applied to the entire year.

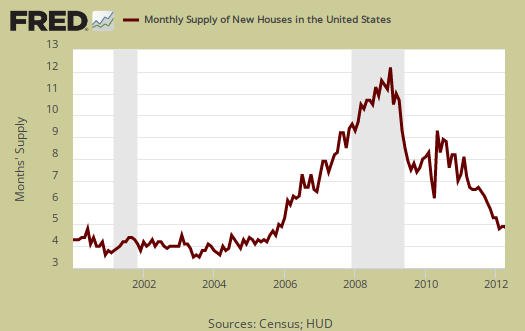
The current supply of new homes on the market would now take 5.1 months to sell, assuming current sales rates. The amount of new homes for sale was 146,000 units, annualized and seasonally adjusted. These are record lows in the supply of new homes for sale, as shown in the below graph.

Below is a graph of the months it would take to sell the new homes on the market at each month's sales rate. We can see these inventories vs. sales times have dropped dramatically.

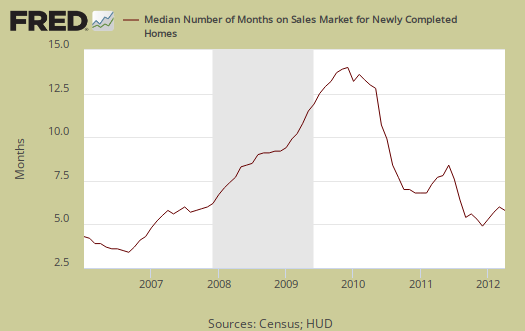
The median time a house was on the market before it sold increased to 8.1 months from 8 months.

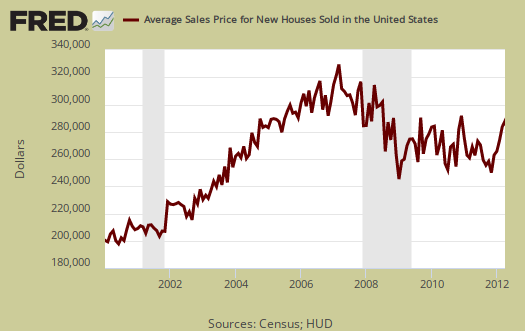
April's average home sale price was $282,600. March's average new home price was $285,800. Both April and March saw at least 1,000 homes selling above $750,000, which affects the monthly median and average sales prices.

April's the median price was $235,700, whereas March's median price was $234,000. Median means half of new homes were sold below this price and both the average and median sales price for single family homes is not seasonally adjusted.

The variance in monthly housing sales statistics is so large, in part, due to the actual volume declining. One needs to look at least a quarter to get a real feel for new home sales, but a year of sales data is more in order. Additionally this report, due to it's huge margin of error, is almost always revised significantly the next month. Buyer beware on month to month comparisons.
What we can say about new homes sales is a bottom does seem to have been hit and we have stabilization. There are those, with vested interests, who somehow believe the U.S. will return to 2004-2006 in residential real estate. Ain't gonna happen, especially with repressed wages, an anemic economy and a jobs crisis going on 5 years.
Calculated Risk is a fantastic analysis site on housing data, with comparisons in new home sales to recessionary periods going back back to 1963.

Recent comments