
In July, New Residential Single Family Home Sales decreased -0.7%, but June was revised downward, from -1.0% to -2.9%. July's volume, annualized was 298,000 and June's annual sale rate was 300,000. This is a +6.8% increase from a year ago. In July 2010, new single family home sales were 279,000.

These numbers are seasonally adjusted, but also with large error margins, outside the actual reported percentages. Weather can influence sales. For example, the error window, (90% deviation), for the monthly percentage change is ±12.9% and the yearly error margin ±13.5%.
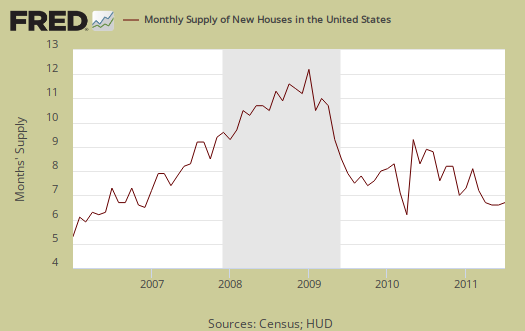
The supply of new homes is now at 6.6 months of inventory, or 165,000, a -26.7% decrease in supply from July 2010.
The median price dropped with the average remaining about the same as last month. In June, the median price was $236,800, whereas July's median price was $222,000. July's average price was $272,300. Below is the monthly median home prices. As you can see the variance is huge, but it looks like 2009 was a bottom.
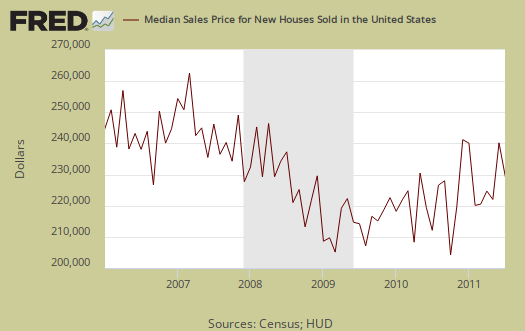
If one looks at median and average sales prices, they are still way out of alignment with wages and salaries, which are flat for over a decade, even with record low mortgage rates. The median time new homes were for sale was 9.4 months; June was 10 months.
Basically the variance in monthly data is so large, all one can say is new home sales are rolling around in a bottom and not much is going to happen with residential real estate until the unemployment rate returns to 5% or so and demand in the economy picks up.
Calculated Risk compares new home sales to recessionary periods and goes back to 1963 in data comparisons.
global real estate comparison to 1 year ago
Someone sent me this site via email and it's a fairly useful table of housing market declines around the globe.
It's not just in the United States.
Averaging apples and oranges
"The world's housing markets were on balance weaker during the year ending in the second quarter of 2011, according to the first-ever published survey covering the Q2 2011 data, released today by the Global Property Guide, which traditionally publishes global housing data ahead of other research houses." -- GlobalPropertyGuide.com
Full disclosure by GlobalPropertyGuide.com is appreciated!
_________
It's interesting, but hard to make a trend out of it, other than what would be expected out of a global liquidity crisis. We kinda already knew about that.
Looking for liquidity crisis effects in residential property, the greatest indicator might well be reduced market volume, at least in some areas. And as we know, market volume is subject to effects of control by governments both public and private (banks) as well as subject to the effects of wealth and income distribution. Then there is the matter of to what extent is residential property leveraged or under water? That's going to vary hugely with differing law from jurisdiction (nation) to jurisdiction (nation).
We have here averages based on annual totals where data bases are not standard and where the rules may even be changing substantially during the course of any given year. Obviously we cannot rely on any assumption that everything cancels out with averages, as though it were an example of a law of rounding, so that valid conclusions can be drawn notwithstanding both material and methodological differences. So, okay, some kind of global trend may be shown ... possibly. But is that trend anything more than the already well-known 'trend' of a liquidity crisis?
In general, price trends without reference to market volume? Moreover, there are bound to be huge variations in underlying conditions and even in the survey numbers criteria:
In much of Europe and elsewhere, residential housing property (resident-owned to varying extent, but with a resident-owned component) routinely includes multiple units -- to a much greater extent than in USA.
"In Latvia, standard type apartments in Riga fell by 5.40% year-on-year, after a solid comeback since Q2 2010."
Housing in Singapore, and maybe even in Hong Kong, is essentially a government monopoly.
"In Taiwan and Singapore, government curbs seem to have been effective."
"Government curbs" in Singapore? That's one way of describing a market that is and has long been effectively controlled by the government, much of it effectively government-owned.
Residential real estate in Sweden is dominated by regulatory controls designed to prevent homelessness and ... well, the word that comes to mind is 'socialism', not that there's anything wrong with it.
And then there are the parenthetical methodological notes --
Ukraine - Kiev
Greece - Athens
Australia - 8 cities
Poland - Warsaw
Latvia - Riga
Japan - Tokyo
Lithuania - 5 largest cities (who knew Lithuania included 5 cities?)
China - Shanghai
Indonesia - 14 cities
Estonia - Tallinn
Brazil - Sao Paulo
Why not "US - San Francisco"?
This data may be of some value to real estate brokers dealing in (promoting) international purchases, but otherwise ????
Oh well. It's "location, location, location." Or is it "perceived value, perceived value, perceived value"?
Either way, I suppose "global" is part of it. The set of all sets ... does it include itself?
CDOs vs. supply-demand, local, location
I'm not surprised at all for I believe derivatives based on Mortgage Backed Securities was global as a poker game, plus there was a global economic recession for the most part.
In certain geographical areas there is a local economy as well as supply-demand. San Francisco has limited supply and is still considered one of those "status" places for the uber-rich, as is Marin county. You have tech CEOs and VCs around to jack it all up. Income inequality is massive in the bay area, so much for the city of hippie love.
Then, Manhattan was over-inflated but Washington D.C. has a thriving economy, in part thanks for huge government contracts and there is also an impossible traffic gridlock, so finding something within driving distance pops up the prices.
I got this send to the site administration email and for anyone else reading this, look, if you want EPers to read your article, blog or whatever, there are two options: first, if it's not economic fiction or has some political bias that flows into economic fiction, we do encourage cross posting. If you want someone to read your article in reference to an article on EP, just leave it in a comment, it will get published unless it's again economic fiction or hostile or spam.
Yes
I agree with your remarks on San Francisco, Manhattan and Washington, D.C.. Also that the 'poker game' is global with global consequences.
Not sure about advice on cross-posting. All I have done here is looked at and critiqued link posted for GlobalPropertyGuide.com, but I never said and would not say that said source is economic fiction, hostile or spam. They have disclosed their limitations, including that they are striving for earliest stats reports in their field.
Of course, sometimes (not relating to GlobalPropertyGuide, I don't believe) political bias flows into economic fiction. Problem is that the streams of politics and economics are intertwined, and it's difficult or impossible to find coverage of politics without bias. For that matter, it's difficult to find reports of econometric data that are without bias. EP in that regard is as good as it gets, and I try to respect that.
I do frequently suggest EP to friends, but I have never posted at EP to my article or other work anywhere but at EP, and I have posted a reference to EP outside EP only once -- that being recently at Michael Collins' themoneyparty webpage.
you can, not referring to you
Just generally for lately the email, which is supposed to be not for "look at what I wrote" content, is getting flooded. But people can, although sometimes formatting a post so it's professional, since this site does not limit authors on formatting, is getting to be a real serious conflict that I am considering changing....to avoid conflict over screwed up posts (by screwed up I mean XHTML formatting issues).
No bottom yet?
Seems to me that I have seen a bottom established in some areas, but it's so low that no corporate source wants to acknowledge it.
Calling attention to ZeroHedge from column on left, republished "courtesy of Lee Adler of the Wall Street Examiner", "Housing Time Bomb Goes Tick Tock Tick Tock"
(complete with graphs, not shown here for reasons of intellectual property rights)
A wag ('Earl of Chiswick') at ZeroHedge calls it "the soon to be announced Fannie Fredie Rent America program"!
I diagnose the basic problem as constipation of the banking tract complicated by infestation of parasitic cockroach, Diplotera incorporata. Not a pretty picture.