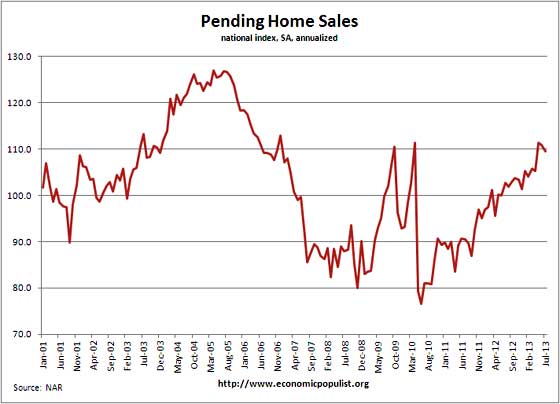
The National Association of Realtors Pending Home Sales declined by -1.3% in July. This is the second month in a row where pending home sales have declined as June dropped by -0.4% Pending home sales have increased 6.7% from a year ago. Pending home sales are also back to November 2006 housing bubble year levels.

The above graph shows pending home sales are showing a monthly decline after an incredible run up. May's PHS increased by 5.8% for example. Pending home sales have still increased annually for last 27 months in a row, so this appears not to be a plunge, but a potential leveling off of the dramatic monthly increases.
The PHSI are contracts which have not yet closed and why pending home sales are considered a future housing indicator. The PHSI represents future actual sales, about 45 to 60 days from signing. From the NAR:
NAR's Pending Home Sales Index (PHSI) is released during the first week of each month. It is designed to be a leading indicator of housing activity.
The index measures housing contract activity. It is based on signed real estate contracts for existing single-family homes, condos and co-ops. A signed contract is not counted as a sale until the transaction closes. Modeling for the PHSI looks at the monthly relationship between existing-home sale contracts and transaction closings over the last four years.
Here are the regional pending home sales from the NAR report:
The PHSI in the Northeast fell 6.5 percent to 81.5 in July but is 3.3 percent higher than a year ago. In the Midwest the index slipped 1.0 percent to 113.2 in July but is 14.5 percent above July 2012. Pending home sales in the South rose 2.6 percent to an index of 121.5 in July and are 7.7 percent higher than a year ago. The index in the West fell 4.9 percent in July to 108.6, and is 0.4 percent below July 2012.
Shocking NAR mentions homes becoming unaffordable in certain regions and the need for new construction to alleviate home prices and thus increase demand. The Case-Shiller city home price indices bear this out.
Another factor in residential real estate declines are mortgage interest rates. Mortgages just jumped to a 2013 record high, 4.8%. This is a full one percentage point increase in mortgage rates since May. Applications just dropped -2.5% in the week of August 23rd and the week previous saw mortgage applications declining by -4.6%. Refinancing one's home has also declined:
Higher rates have dissuaded borrowers from refinancing existing home loans. The refinance index fell 5.4 percent last week, and the refinance share of total mortgage activity slid to 60 percent, the lowest since April of 2011.
There was a new mortgage regulation proposed where banks could no longer not hold some of the mortgage that lender originated. The new rule would instead require banks to hold some portion of the mortgage and thus the risk. Bundling up bad mortgages into derivatives and pawning them off on unsuspecting investors was a catalyst for the financial collapse. That said, if banks cannot play their casino game and actually have to service and hold some of the mortgage they originated and thus some of the risk, we could see consumer credit tighten.
The 505-page draft regulation written by six agencies drops a requirement that lenders retain a stake in mortgages with down payments of less than 20 percent, which appeared in an earlier version of the measure known as the qualified residential mortgage rule.
The NAR also released their projections for this year and 2014. Clearly they are seeing levels maintaining but not increasing much further and the spike in prices to moderate.
NAR projects existing-home sales to increase 10 percent for all of 2013, totaling about 5.1 million, and reach approximately 5.2 million next year. With ongoing supply imbalances, the national median existing-home price is expected to grow nearly 11 percent this year, and moderate to a gain of 5 to 6 percent in 2014, with rising construction taking some of the pressure off of home prices.
Here are our past pending home sales overviews, unrevised.

Recent comments