
Q1 GDP 2011 came in at 1.9% for the third revision, one tenth of a percentage point higher than the second revision. Here is the original BEA GDP report.
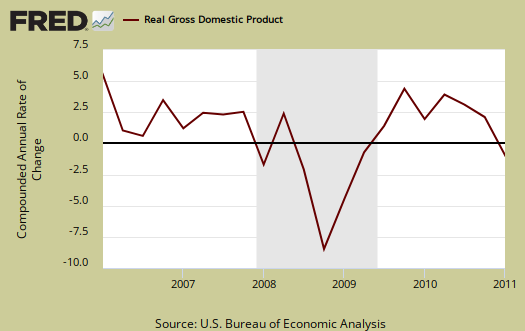
The decrease of Q1 GDP growth is once again, due to the never ending increasing trade deficit, a slow down in personal consumption and a drop in government spending.
As a reminder, GDP is made up of:
where:
Y=GDP, C=Consumption, I=Investment, G=Government Spending, (X-M)=Net Exports, X=Exports, M=Imports*.
Here are the Q1 2011 3rd revision report breakdown of GDP by percentage point contributions:
- C = +1.52
- I = +1.46
- G = –1.20
- X = +0.97
- M = –0.84
Here are the Q1 2011 2nd revision report breakdown of GDP by percentage point contributions:
- C = +1.53
- I = +1.45
- G = –1.07
- X = +1.16
- M = –1.22
Below are the percentage point differences, or spread between the 3rd and 2nd Q1 2011 GDP report component revisions. We see a slowing further in personal consumption than the advance GDP indicated, an increase in imports and exports, and an increase in investment, which balanced out the loss in personal consumption.
- C = -0.01
- I = +0.01
- G = -0.13
- X = -0.19
- M = +0.38
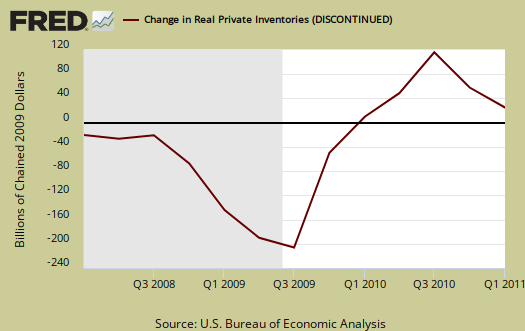
Changes in private inventories surged, was 1.31 of the Q1 GDP percentage contribution versus 1.19 percentage points in the second revision, a change of +0.12. This means changes in private inventories was 69% of Q1 2011 GDP.
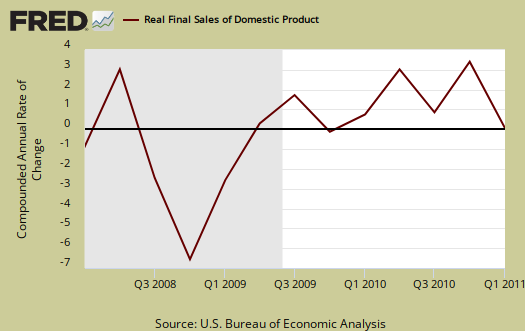
Below are real final sales of domestic product, or GDP - inventories change. This gives a better feel for real demand in the economy. This is the bad news of this GDP revision, it shows real demand was almost flat, a 0.6% increase.
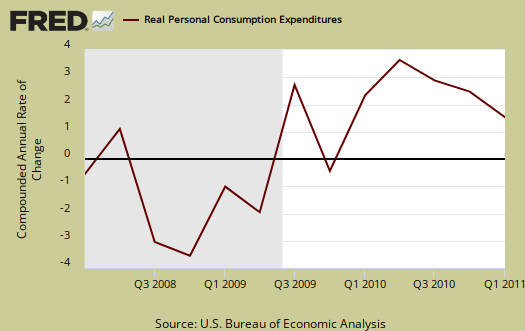
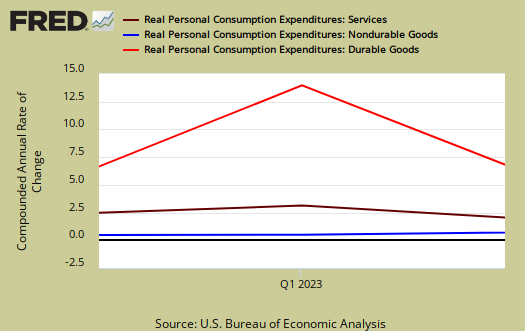
Below the the St. Louis FRED graph for C, or real personal consumption expenditures of the above GDP equation. As we can see from the above, while PCE, or C in the above equation, decelerated in Q1.
Below is the breakdown in C or real PCE annualized change. Notice when times are tough, durable goods (bright red) consumption drops. Notice the deceleration in durable goods this quarter and Durable goods personal consumption was 0.68, a downward 0.25 percentage point revision from the 2nd to 3rd revision to the percentage points of GDP.
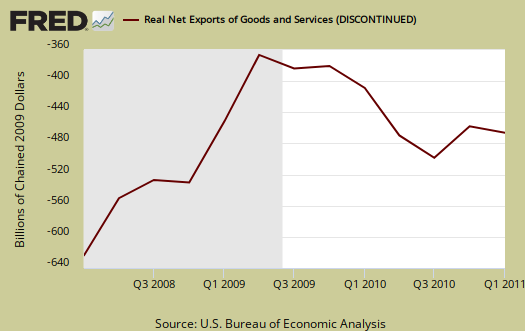
Below are net exports, or trade deficit, in real chained dollars, for Q1 2011. Both imports and exports were revised down, yet imports were revised down more than exports. These revisions do not negate the fact imports dramatically increased from Q4 2010 to Q1 2011.
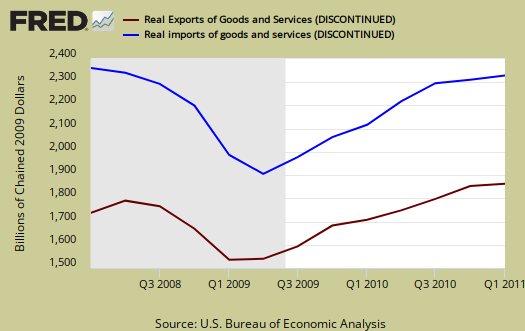
The below graph is real imports vs. exports. While exports increased, it is the trade deficit that matters. We can see imports are starting their acceleration once again.
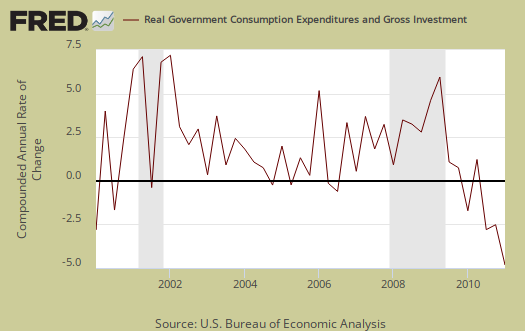
Real Government expenditures have dropped dramatically. In Q1 2011 overall the drop was -5.8% with defense dropping -11.8%, federal declined -8.1% and local, state declining -4.2%. Below is the graph for the last decade on government expenditures.
Below are the percentage changes of Q1 2011 GDP components, revised, in comparison to the forth quarter of 2010:
- C = +2.2%
- I = +12.4%
- G = –5.8%
- X = +7.6%
- M = +5.1%
Motor Vehicles added 1.18, a downward 3rd revision of -0.10, percentage points to Q1 real GDP while computer final sales was upped in the 3rd GDP revision, to +0.10 percentage point changes. This is different from personal consumption, or C auto & parts. Motor vehicles are bought as investment, as fleets by the government and so forth and in Q1, they bought more.
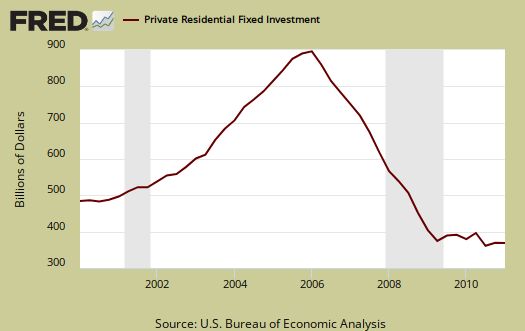
Residential fixed investment subtracted -0.05 percentage points to Q1 GDP after adding a paltry 0.07 percentage points in Q4. Below is the raw totals on residential investment. If one could ever see the housing bubble and then it's collapse in terms of economic contributions, the below graph is it.
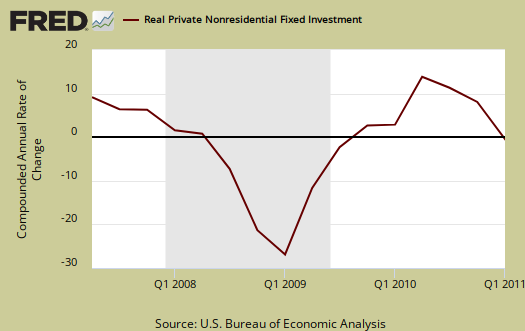
Private, or not from the government, Nonresidential fixed investment was revised, now a 2.0% change from last quarter and was a 0.16 percentage point contribution to Q1 GDP, revised downward. Nonresidential structures was a –14.8% percentage change from Q4 to Q1 alone.
Here are the overview for the Q1 2011 advance GDP report overview.
* In Table 2, the BEA reports GDP contribution components with their equation sign. If durable goods for example, decreased over the quarter or year, it is reported as a negative number. Imports, from the GDP equation, are already a negative for that is not something produced domestically. A negative sign implies imports increased for the time period and a + sign means the change in imports decreased. Or, from the GDP equation: . Confusing but bottom line exports add to economic growth, imports subtract.
Recent comments