
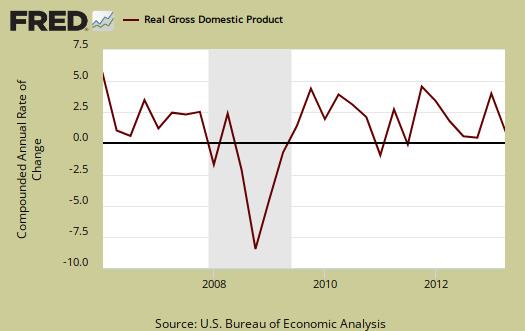
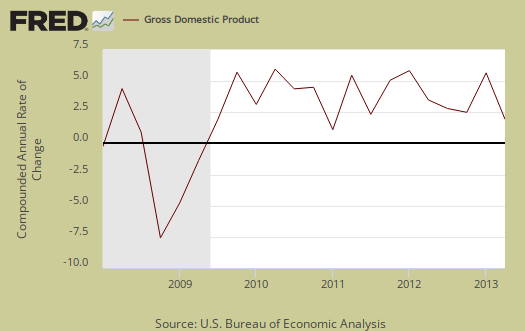
Q2 2013 real GDP was revised significantly upward to 2.5% from the 1.7% originally reported The revision gain was almost all a reduction in the trade deficit as we predicted earlier. The shrink in the trade deficit alone added 0.8 percentage points to Q2 GDP, a welcome change. Unfortunately this is a fluke. The U.S. trade deficit will continue to grow and assuredly depress the next quarter Gross Domestic Product.
As a reminder, GDP is made up of: where Y=GDP, C=Consumption, I=Investment, G=Government Spending, (X-M)=Net Exports, X=Exports, M=Imports*.
The below table shows the percentage point spread breakdown from Q1 to Q2 GDP major components. GDP percentage point component contributions are calculated individually.
| Comparison of Q1 2013 and Q2 2013 GDP Components | |||
|---|---|---|---|
|
Component |
Q1 2013 |
Q2 2013 |
Spread |
| GDP | +1.15 | +2.51 | +1.36 |
| C | +1.54 | +1.21 | -0.33 |
| I | +0.71 | +1.48 | +0.77 |
| G | –0.82 | –0.18 | +0.64 |
| X | –0.18 | +1.11 | +1.29 |
| M | –0.10 | –1.11 | –1.01 |
The next table shows the revisions and spread between the major components of Q2 GDP. As we can see the trade deficit figures were significantly revised.
| Comparison of Q2 2013 Component Revisions | |||
|---|---|---|---|
|
Component |
Q2 2013 2nd Revision |
Q2 2013 1st Revision |
Spread |
| GDP | +2.51 | +1.68 | +0.83 |
| C | +1.21 | +1.22 | –0.01 |
| I | +1.48 | +1.34 | +0.14 |
| G | –0.18 | –0.08 | –0.10 |
| X | +1.11 | +0.71 | +0.40 |
| M | –1.11 | –1.51 | +0.40 |
Consumer spending, C in our GDP equation, shows less growth than Q1 and didn't change between revisions. In terms of percentage changes, real consumer spending increased 1.8% in Q2 in comparison to a 2.3% increase in Q1. The breakdown in consumer spending shows services adding a 0.48 percentage point contribution and goods giving a 0.73 percentage point contribution to PCE. Durable goods consumer spending contributed 0.45 percentage points to personal consumption expenditures. Below is a percentage change graph in real consumer spending going back to 2000. Hey, this isn't a good thing, but health care spending added 0.29 percentage points to real GDP.
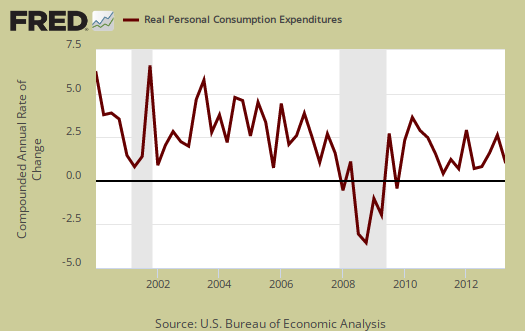
Graphed below is PCE with the quarterly annualized percentage change breakdown of durable goods (red or bright red), nondurable goods (blue) versus services (maroon).

Imports and Exports, M & X canceled each other out and together added nothing to Q2 GDP. While nothing sounds bad, when it comes to the trade deficit this is actually good news, abet temporary. Percentage point contributions represent change from the previous quarter and generally speaking imports subtract from GDP. The trade deficit still generally speaking harms U.S. economic growth.

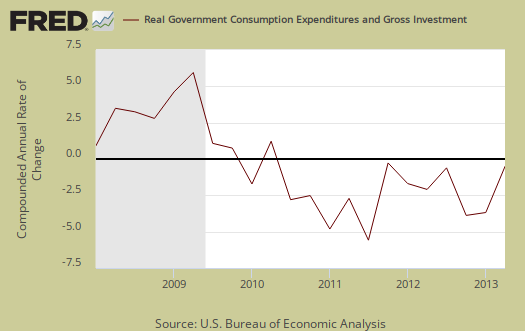
Government spending, G was revised downward by a tenth of a percentage point to –0.18 percentage points of Q2's GDP, a -0.9% percentage decline from Q1. It looks like the national defense spending rout is over, with just another –0.6% drop for Q2, after two quarters of implosion, although nondefense federal spending declined by -3.2%. State and local governments spending was revised and now also subtracted -0.05 percentage points from Q2 GDP. Below is the percentage quarterly change of government spending, adjusted for prices, annualized.
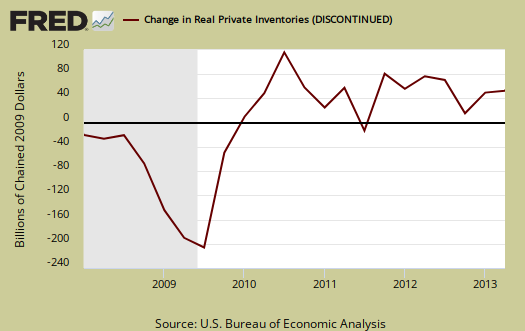
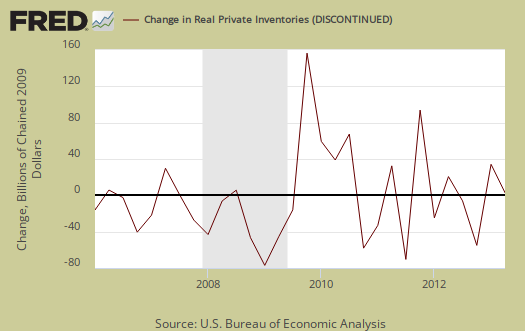
Investment, I is made up of fixed investment and changes to private inventories. The change in private inventories alone gave a +0.59 percentage point contribution to Q2 and this revised significantly from the advance GDP +0.41 estimate. Changes in private inventories were less than Q1 as farm inventories returned to a more normal contribution level, 0.14 percentage points. Retail trade inventories saved the day and one can only assume the advance estimate had low balled these inventories for the actual monthly report was bad news. From the technical note it appears possible June's retail trade inventories has very recently be revised upwards and the advance report on durable goods did show an upward revision for June. Below are the change in real private inventories and the next graph is the change in that value from the previous quarter.
Fixed investment is residential and nonresidential and is a bright spot in the Q2 GDP report, as it was in Q1. Overall, fixed investment contributed +0.90 percentage points to GDP and was only slightly revised from the advance GDP estimate.

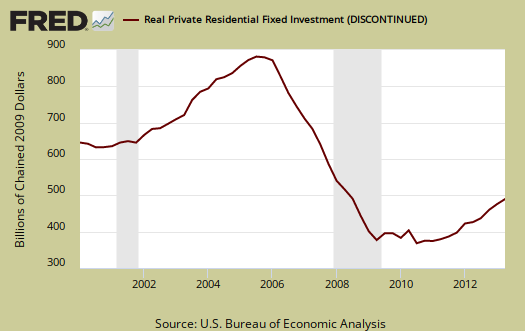
Part of fixed investment is Residential fixed investment. Residential contributed +0.37 percentage points to Q2 GDP. One can see the housing bubble collapse in the below graph and also how there is no meteoric recovery in terms of economic growth, but a modest one, for the last two quarters, in spite of all of the housing talk . Nonresidential fixed investment added 0.53 percentage points but this is in part due to the addition of intellectual property into GDP calculations.
The price index for gross domestic purchases, was not revised and was 0.3% for Q2. The price index, in comparison, was 1.2% for Q1. This means there was less inflation in comparison to last quarter. Since the price index is used to remove inflation from GDP to obtain real growth, less inflation means less price increases to eat away at economic growth. The core price index, or prices excluding food and energy products, was 0.9%,an decrease of -0.5 percentage points from Q1 . The core price index is another Fed watch number for quantitative easing tapering.
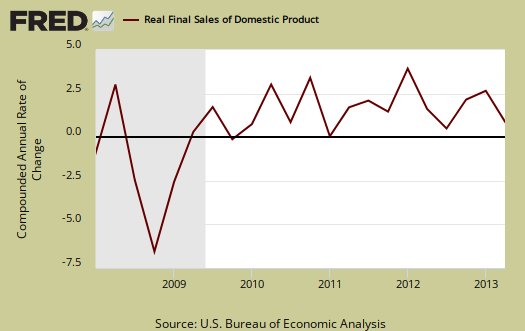
Real final sales of domestic product is GDP - inventories change aand gives a better indicator for real demand in the economy. This is because while private inventories represent economic activity, the stuff is sitting on the shelf, it's not demanded or sold. Real final sales increased 1.9% for Q2, which actually still reflects weak demand, but a huge improvement from Q1's 0.2% real final sales.

Gross domestic purchases are what U.S. consumers bought no matter whether it was made in Ohio or China.  ; It's defined as GDP plus imports and minus exports or using our above equation: where P = Real gross domestic purchases. Real gross domestic purchases only increased 2.4% in Q2 in comparison to 1.4% in Q1. Exports are subtracted off because they are outta here, you can't buy 'em, but imports, as well a know all too well, are available for purchase at your local Walmart. When gross domestic purchases exceed GDP, that's actually bad news, it means America is buying imports instead of goods made domestically.
GNP - Gross National Product: Real gross national product, GNP, is the goods and services produced by the labor and property supplied by U.S. residents.
GNP = GDP + (Income receipts from the rest of the world) - (Income payments to the rest of the world)
Real GNP increased 3.0% in Q2 whereas Q1 GNP increased by 0.6%. GNP includes, GDP excludes net income from the rest of the world. GNP is bigger than GDP if Americans made out like bandits from foreign investments more than foreigners cashed in on investments within the U.S. borders. The fact GNP is bigger than GDP implies a lot of Americans are making a lot of money while operating and investing outside the U.S. borders.

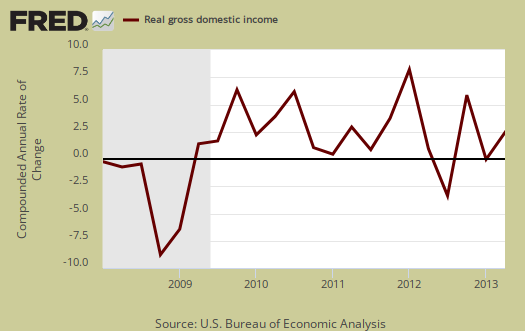
GDI - Gross Domestic Income: Gross Domestic Income is all income from within the borders of a nation and should normally equal GDP. GDI is wages, profits & taxes minus subsidies. Real GDI increased 2.5% in Q1 in comparison to a 5.5% increase in Q4.
Nominal GDP: In current dollars, not adjusted for prices, of the U.S. output,was $16,667.9 billion, an 3.2% increase from Q1, quite a revision from the originally reported 2.4%. In Q1, current dollar GDP increased 2.8%. All figures are annualized.
Real final sales of domestic product is GDP - inventories change. This gives a better feel for real demand in the economy. This is because while private inventories represent economic activity, the stuff is sitting on the shelf, it's not demanded or sold. Real final sales increased 1.3% for Q2, which reflects weak demand. Q1 real final sales were basically flat, only a 0.2% increase.
Below are the percentage changes of Q2 2013 GDP components, from Q1. There is a difference between percentage change and percentage point change. Point change adds up to the total GDP percentage change and is reported above. The below is the individual quarterly percentage change, against themselves, of each component which makes up overall GDP. Additionally these changes are seasonally adjusted and reported by the BEA in annualized format.
|
Q2 2013 Component Percentage Change (annualized) |
|||
|---|---|---|---|
| Component | Percentage Change from Q1 | ||
| GDP | +2.5% | ||
| C | +1.8% | ||
| I | +9.9% | ||
| G | –0.9 % | ||
| X | +8.6% | ||
| M | +7.0% | ||
The BEA's comparisons in percentage change breakdown of 4th quarter GDP components are below. Changes to private inventories is a component of I.
C: Real personal consumption expenditures increased 1.8 percent in the second quarter, compared with an increase of 2.3 percent in the first. Durable goods increased 6.1 percent, compared with an increase of 5.8 percent. Nondurable goods increased 1.8 percent, compared with an increase of 2.7 percent. Services increased 1.1 percent, compared with an increase of 1.5 percent.
I: Real nonresidential fixed investment increased 4.4 percent in the second quarter, in contrast to a decrease of 4.6 percent in the first. Nonresidential structures increased 16.1 percent, in contrast to a decrease of 25.7 percent. Equipment increased 2.9 percent, compared with an increase of 1.6 percent. Intellectual property products decreased 0.9 percent, in contrast to an increase of 3.7 percent. Real residential fixed investment increased 12.9 percent, compared with an increase of 12.5 percent.
X & M: Real exports of goods and services increased 8.6 percent in the second quarter, in contrast to a decrease of 1.3 percent in the first. Real imports of goods and services increased 7.0 percent, compared with an increase of 0.6 percent.
G: Real federal government consumption expenditures and gross investment decreased 1.6 percent in the second quarter, compared with a decrease of 8.4 percent in the first. National defense decreased 0.6 percent, compared with a decrease of 11.2 percent. Nondefense decreased 3.2 percent, compared with a decrease of 3.6 percent. Real state and local government consumption expenditures and gross investment decreased 0.5 percent, compared with a decrease of 1.3 percent.
Other overviews on gross domestic product can be found here.
Recent comments