
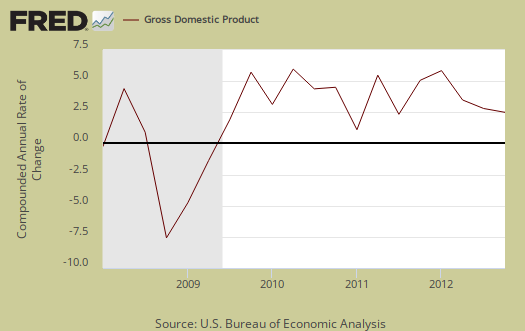
Q4 2012 real GDP was revised upward by 0.3 percentage points to 0.4% after the second revision. While an improvement, gross domestic product results still imply a stagnant economy in the 4th quarter. Government spending declines were the drag on the economy and sucked out -1.41 percentage points from 4th quarter real gross domestic product growth. Federal defense spending alone declined 22.1% from Q3. Nonresidential fixed investment was revised higher and businesses purchased equipment and software. Private inventory changes hacked off -1.52 percentage points from Q4 real GDP as businesses shed their inventories. Even without inventories in the economic growth mix, the economy is still suffering from weakness in demand.
Consumer spending was revised down to a barely breathing +1.28 percentage point contribution. Consumer spending was driven by durable goods purchase as they were a full percentage point of Q4's GDP. Real imports contracted more than realized and thus increased Q4 GDP.
As a reminder, GDP is made up of: where Y=GDP, C=Consumption, I=Investment, G=Government Spending, (X-M)=Net Exports, X=Exports, M=Imports*.
The below table shows the percentage point spread breakdown from Q3 to Q4 GDP major components. GDP percentage point component contributions are calculated individually.
| Comparison of Q3 2012 and Q4 2012 GDP Components | |||
|---|---|---|---|
|
Component |
Q3 2012 |
Q4 2012 |
Spread |
| GDP | +3.10 | +0.37 | -2.73 |
| C | +1.12 | +1.28 | +0.16 |
| I | +0.85 | +0.17 | -0.68 |
| G | +0.75 | –1.41 | -2.16 |
| X | +0.27 | –0.40 | -0.67 |
| M | +0.11 | +0.73 | +0.62 |
This next table compares the change in Q4 revisions from the real GDP percentage point contribution spread perspective.
| Comparison of Q4 2012 GDP Component Revisions | |||
|---|---|---|---|
|
Component |
Q4 2012, 2nd Revision |
Q4 2012, 3rd revision |
Spread |
| GDP | +0.13 | +0.37 | +0.24 |
| C | +1.47 | +1.28 | -0.19 |
| I | –0.20 | +0.17 | +0.37 |
| G | –1.38 | –1.41 | -0.03 |
| X | –0.55 | –0.40 | +0.15 |
| M | +0.79 | +0.73 | -0.06 |
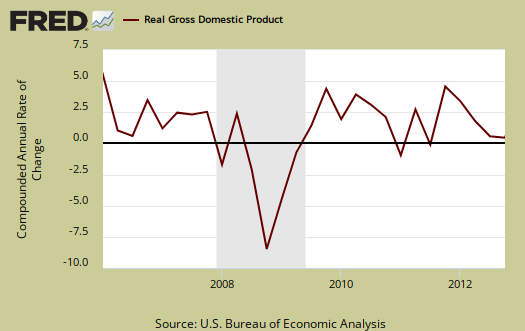
Consumer spending, C in our GDP equation, showed an increase from Q3. Durable goods consumer spending drove the rise, with a 1.00 percentage points to personal consumption expenditures. In terms of percentage changes, real consumer spending increased 1.8% in Q4 in comparison to a 1.6% increase in Q3. Below is a percentage change graph in real consumer spending going back to 2000 to show Q4 consumer spending is nothing to write home about.

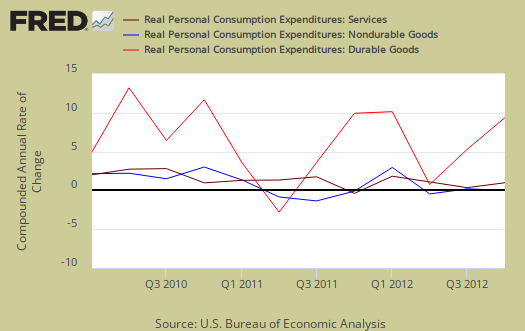
Within personal consumption expenditures, motor vehicles & parts alone was a 0.53 percentage point contribution and recreational goods & vehicles added 0.25 percentage points. Services spending was a 0.27 percentage point contribution to real GDP, revised down from 0.44. Within services, housing and utilities subtracted -0.54 percentage points from real GDP. These values have been adjusted for inflation so one cannot blame falling energy prices or decreased rent. Graphed below is PCE with the quarterly annualized percentage change breakdown of durable goods (red or bright red), nondurable goods (blue) versus services (maroon).
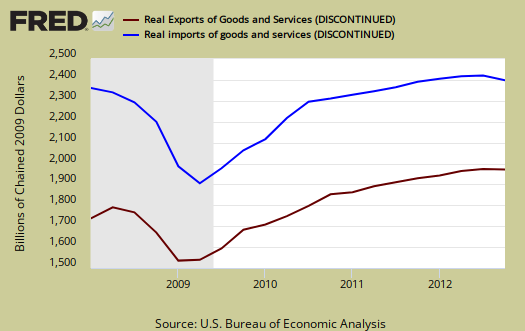
Imports and Exports, M & X were not greatly revised. Both exports and imports imploded, but imports more than exports. Thus the change in trade deficit gave 0.33 percentage point contribution to real Q4 GDP, which helped the U.S. economy. The below graph shows real imports vs. exports in billions. The break down of the GDP percentage change to point contributions gives a clear picture on how much the trade deficit stunts U.S. economic growth.
Government spending, G was -1.41 percentage points of Q4's meager +0.37% GDP. This was all federal spending, and of that Federal –1.23 percentage point GDP contribution, –1.28 of it was national defense. The decline in defense spending is not a one time thing as budget cuts for the department of defense have already been announced. State and local governments subtracted -0.18 percentage points from Q4 GDP. Local and state governments are still hurting and contracting in their expenditures. Below is the percentage quarterly change of government spending, adjusted for prices, annualized.

Investment, I is made up of fixed investment and changes to private inventories. The change in private inventories alone gave a –1.52 percentage point contribution to Q4 GDP, barely revised from the 2nd GDP estimate. Below are the change in real private inventories and the next graph is the change in that value from the previous quarter.
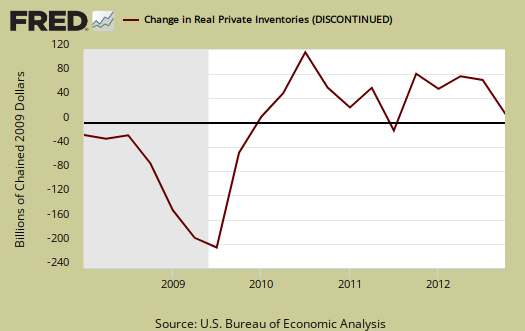

This was businesses contracting their inventories, and that's a really bad sign on how much demand they see for their products in the future. Non-farm changes in inventories hacked off –1.66 percentage points from Q4 GDP growth and this reducing inventories on hand for industry can be blamed for D.O.A. economic growth. The drought is over as farm inventories added 0.14 percentage points to real GDP.
Fixed investment is residential and nonresidential and is a bright spot in the Q4 GDP report. Overall, fixed investment contributed +1.69 percentage points to GDP and was significantly revised up from the 2nd estimate. Equipment and software business investment gave a 0.82 percentage point contribution to GDP. This is a good sign for the future. Businesses are reinvesting and runs contrary to the shedding of excessive inventory.

Residential fixed investment was +0.41 percentage point contribution to Q4 GDP. One can see the housing bubble collapse in the below graph and also how there is no meteoric recovery for Q4, in spite of all of the housing data hype.

Motor Vehicles as a whole, as output, was 0.18 percentage points of Q4 real GDP. Computer final sales, contributed to GDP by 0.10 percentage points. These categories are different from personal consumption, or C sub-components, such as auto & parts. These are overall separate indices to show how much they added to GDP overall. Motor vehicles, computers are bought as investment, as fleets, in bulk, by the government, as well as part of consumer spending, government spending and so on.
Overall, services slammed GDP with a -0.84 percentage point contribution while goods, overall added +0.40 percentage points. Structures, overall, which is building activity, both residential and commercial and economic activity it generates, contributed +0.82 percentage points to Q4 real GDP.
The price index for gross domestic purchases, was 1.6% for Q4 in comparison to 1.4% for Q3. This means there was inflation was on par with last quarter. Also, the price index was revised upward another 0.1 percentage points. Since the price index is used to remove inflation from GDP to obtain real growth, it seems we had more price increases than real economic activity than previously thought in Q4. Core price index, or prices excluding food and energy products, was 1.2%, the same as Q3 .
Nominal GDP: In current dollars, not adjusted for prices, Q4 GDP, or the U.S. output, is $15,864.1 billion, an 1.3% increase from Q3's $15.811 trillion. Q3 saw a 5.9% increase in nominal GDP. Applying the price indexes, or chained, real 2005 dollars, Q4 2012 GDP was $13,665.4 brillion. All figures are annualized.
Gross domestic purchases are what U.S. consumers bought no matter whether it was made in Ohio or China. It's defined as GDP plus imports and minus exports or using our above equation: where P = Real gross domestic purchases. Real gross domestic purchases were revised to unchanged in Q4 in comparison to a 2.6% increase in Q3. Exports are subtracted off because they are outta here, you can't buy 'em in the United States. Imports, on the other hand, are available for purchase at your local Walmart. When gross domestic purchases exceed GDP, that's actually bad news, it means America is buying imports instead of goods made domestically or not buying much at all.
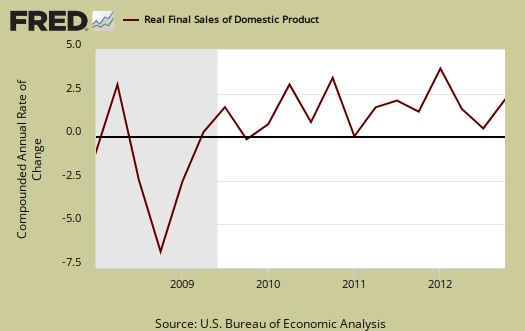
Real final sales of domestic product is GDP - inventories change. This gives a better feel for real demand in the economy. This is because while private inventories represent economic activity, the stuff is sitting on the shelf, it's not demanded or sold. Real final sales increased 1.9% for Q4, which reflects weak demand, even though it was revised upward from 1.7% in the second GDP estimate. Although this is much better news than the advance report in terms of economic demand. Q3 real final sales increased 2.4%.
Below are the percentage changes of Q4 2012 GDP components, from Q3. There is a difference between percentage change and percentage point change. Point change adds up to the total GDP percentage change and is reported above. The below is the individual quarterly percentage change, against themselves, of each component which makes up overall GDP. Additionally these changes are seasonally adjusted and reported by the BEA in annualized format.
|
Q4 2012 Component Percentage Change (annualized) |
|||
|---|---|---|---|
| Component | Percentage Change from Q3 | ||
| GDP | +0.1% | ||
| C | +1.8% | ||
| I | +1.3% | ||
| G | –7.0% | ||
| X | –2.8% | ||
| M | –4.2% | ||
The BEA's comparisons in percentage change breakdown of 4th quarter GDP components are below. Changes to private inventories is a component of I.
C: Real personal consumption expenditures increased 1.8 percent in the fourth quarter, compared with an increase of 1.6 percent in the third. Durable goods increased 13.6 percent, compared with an increase of 8.9 percent. Nondurable goods increased 0.1 percent, compared with an increase of 1.2 percent. Services increased 0.6 percent, the same increase as in the third.
I: Real nonresidential fixed investment increased 13.2 percent in the fourth quarter, in contrast to a decrease of 1.8 percent in the third. Nonresidential structures increased 16.7 percent; it was unchanged in the third quarter. Equipment and software increased 11.8 percent, in contrast to a decrease of 2.6 percent. Real residential fixed investment increased 17.6 percent, compared with an increase of 13.5 percent.
X & M: Real exports of goods and services decreased 2.8 percent in the fourth quarter, in contrast to an increase of 1.9 percent in the third. Real imports of goods and services decreased 4.2 percent, compared with a decrease of 0.6 percent.
G: Real federal government consumption expenditures and gross investment decreased 14.8 percent in the fourth quarter, in contrast to an increase of 9.5 percent in the third. National defense decreased 22.1 percent, in contrast to an increase of 12.9 percent. Nondefense increased 1.7 percent, compared with an increase of 3.0 percent. Real state and local government consumption expenditures and gross investment decreased 1.5 percent, in contrast to an increase of 0.3 percent.
Here is our overview for Q3 GDP previous estimate, here is the overview for Q4 GDP second revision. Other reports on gross domestic product can be found here.
Recent comments