
The July 2011 Residential construction report showed Housing starts decreased -1.5% from June, to a level of 604,000. This is 9.8% above July 2010, or 550,000 housing starts. New Residential Construction has a margin of error often above the monthly percentage increases, so take these monthly changes with a grain of salt. July, for example, has a error margin of 10.8 percentage points. June was revised to 617,000 units from 629,000. Graphs are critical in this economic report, for while the monthly numbers seem dramatic, in looking at the levels one can see this sector is still depressed.
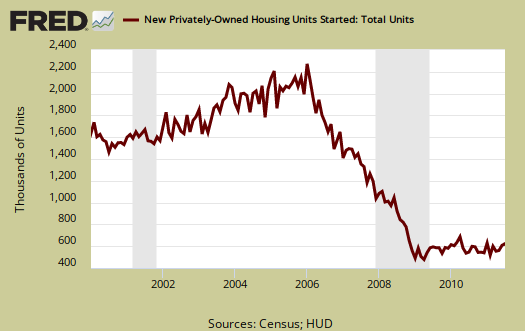
Single family housing starts decreased -4.9% from June. Single family housing is 75% of all residential housing starts.
Housing of 5 or more units increased 6.3% for July and is up 66.7% for the year. Guess all of those people who were foreclosed on will need an apartment now, assuming they have any money to make rent. In other economic reports, rental vacancy rates are dropping and rents are increasing.
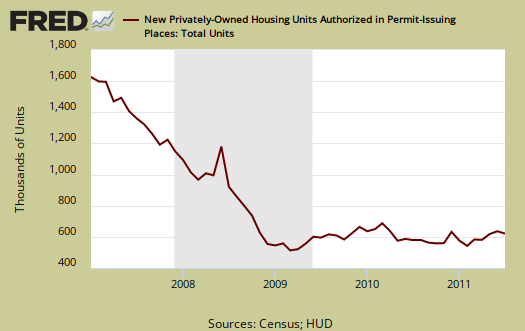
Building permits, also decreased -3.2% to 597,000 and are up 3.8% from this time last year. Single family building permits increased 0.5% from June. Building permits have much less statistical error, 1.2 percentage points, than housing starts. Below is the St. Louis Federal Reserve FRED graph for Building permits. The graph shows building permits are not always a smooth line from month to month.
Housing Completions popped up by 11.8% and are now up 9.5% from July 2010. Calculated Risk calculates a 1 year lag between housing starts and completions, so this number reflects housing starts from 2010.
This report has a large variance, so to establish a trend line one must take into account months of data. This report is also seasonally adjusted and residential real estate is highly seasonal.
One thing to take away from this report is multi-family, otherwise known as rental units, are really taking off and no surprise there since the mortgage lending standards are so tight and there are so many foreclosures. A silver lining to the destruction of the American Dream.
I recommend Calculated Risk, the uber site on housing data, for more graphs and analysis and especially this interesting correlation of the unemployment rate to housing starts graph and article.
Here are May's graphs and original numbers.
Recent 'Random Lengths'
Remarkable correlation in Calculated Risk's graph inversely relating unemployment rate to housing starts! There's something "normal" about that, something to be expected.
Residential "starts" can mean almost anything. Starts at any stage, of course, can sit unfinished for years, although there is always a tendency to keep the ball rolling and finish up -- but that's because of the financing and the terms of the financing. Also income tax and UI considerations.
Permits cost money and so they mean something, but how much they cost can be critical. The rate of change for permits has been influenced by reactions of local jurisdictions to the economy -- offering greatly reduced impact fees and then back the other way as the public reacts negatively to the implied loss of revenue, amounting to a subsidy of builders by home-owners. Investors may sit on low-cost permits just for their spec value, hedging against prospect of a return to increased fees. Meanwhile, inspectors may be sitting around at zoning and building departments, nothing to do, best to keep their heads down.
Building supply prices are a significant factor to be considered. Builders are not exactly confident about the economy. Here's an excerpt from Random Length current summary for framing lumber (week ending August 12, 2011) -
Here's excerpts from Random Lengths' "Through a Knothole" --