
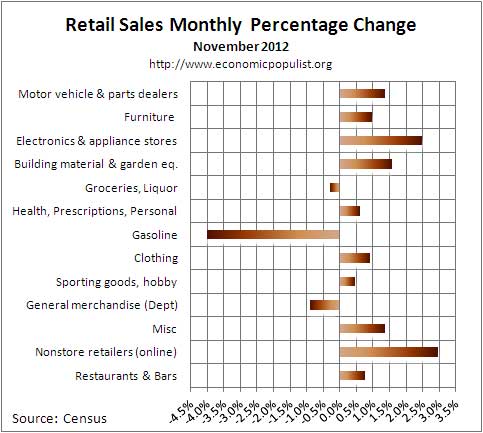
November 2012 Retail Sales increased, by 0.3%. Gasoline sales tanked -4.0% from October on lower prices. If one removes gasoline sales from retail sales, overall the increase from October would have been 0.8%. Auto sales increased 1.6% and minus all autos & parts but including gas sales, retail sales had no change from last month. Retail sales are reported by dollars, not by volume with price changes removed.
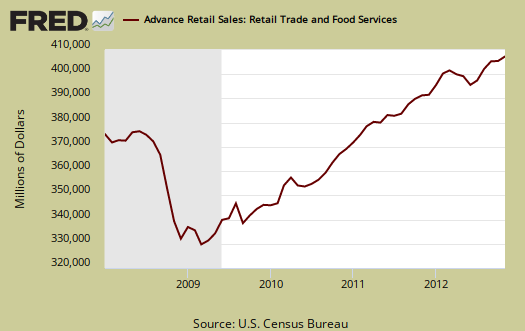
For the three month moving average, from September to November in comparison to June to August, retail sales have increased 2.0%. In comparison to a year ago, retail sales are up 4.3%.
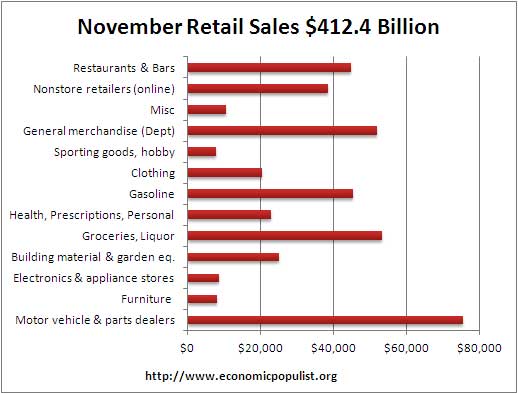
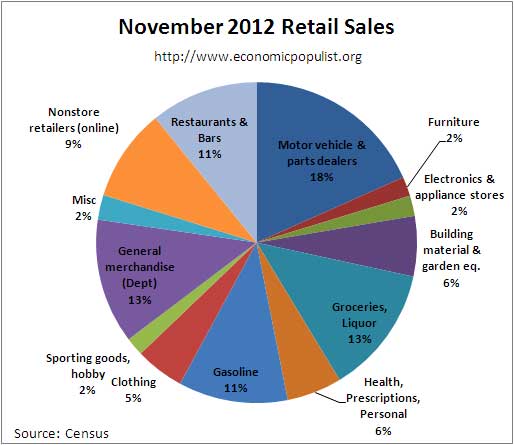
Total retail sales are $412.4 billion for November. Below are the retail sales categories monthly percentage changes. These numbers are seasonally adjusted. General Merchandise includes super centers, Costco and so on. We see retail sales increased and it appears black Friday Thursday-Monday is showing up in sales with online shopping making increasing gains. Nonstore retail sales have increased 11.1% from last year.
Retail trade sales are retail sales minus food and beverage services. Retail trade sales includes gas, and is up 0.2% for the month, up 3.4% from last year. Gasoline station sales have increased 0.8% from one year ago, essentially flat whereas things people can do without, sporting goods, hobbies, books & music sales have increased 7.1% from last year. Auto dealer sales have increased 6.3% from last year.
Below are the November retail sales categories by dollar amounts. As we can see, cars are king when it comes to retail sales. We also see that electronics is much smaller by total dollars.
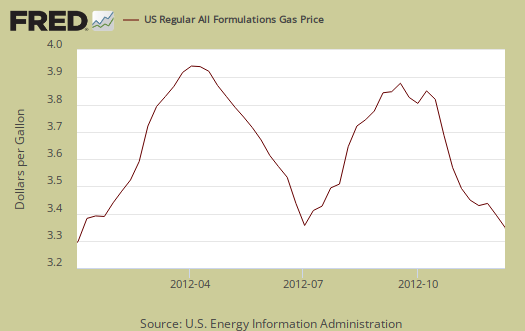
For reference sake, graphed below are weekly regular gasoline prices, so one can see what happened to gas prices in November.
The below pie chart breaks down the monthly seasonally adjusted retail sales by category as a percentage of total November sales by dollar amounts. One can see how dependent monthly retail sales are on auto sales by this pie chart. We also see non-traditional retailers making strong grounds on traditional general merchandise stores.
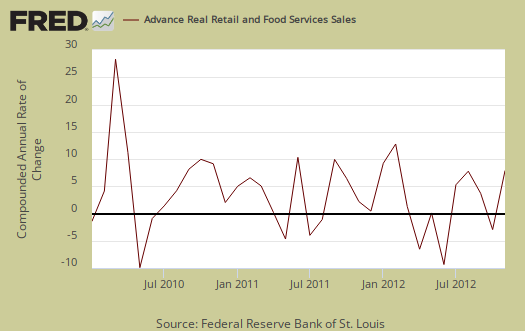
Retail sales correlates to personal consumption, which in turn is about 70% of GDP growth. Yet GDP has inflation removed from it's numbers. This is why Wall Street jumps on these retail sales figures. Below is the graph of retail sales in real dollars, or adjusted for inflation, so one gets a sense of volume versus price increases. Below is the annualized monthly percentage change in real retail sales, monthly.
To obtain real values, retail sales are deflated using CPI. Below are the real retail sales quarterly annualized percent change. Q4 is not displayed in the below graph.

Below is a graph of real PCE against real retail sales, quarterly. See how closely the two track each other? PCE almost looks like a low pass filter, an averaging, removal of "spikes", of real retail sales. Here are our overviews for PCE. Here is our overview of Q3 GDP.

Retail sales are not adjusted for price increases, not reported in real dollars. Real economic growth adjusts for inflation. Retail sales has variance, margins of error, and is often revised as more raw data comes into the U.S. Department of Commerce (Census division). For example, this report has an error margin of ±0.5%. Data is reported via surveys, and is net revenues of retail stores, outlets. Online retail net revenues are asked in a separate survey of large retail companies (big box marts). This is also the advanced report. To keep the monthly nominal percentage changes in perspective, below is the graph of monthly percentage changes of retail sales since 2008.

Seasonal adjustments are aggregate and based on events like holidays associated with shopping, i.e. the Christmas rush.
Advance reports almost always are revised the next month as more raw sales data is collected by the Census.
Here is our retail sales topic category.
Recent comments