
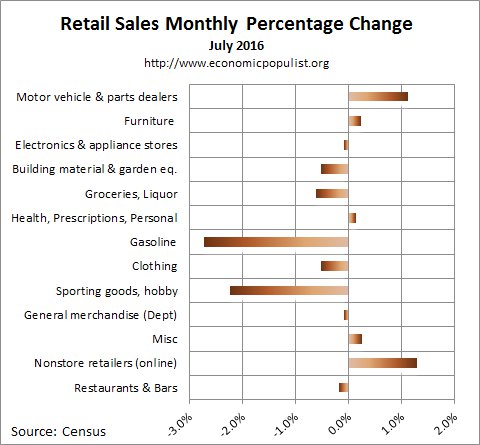
July 2016 retail sales were a real Wall Street let down as there was no change from June. Gasoline sales plunged by -2.7%, yet most retailers had declining sales. Auto sales and Amazon prime day were not enough to salvage overall retail sales. Without autos & parts sales, retail sales would have dropped by -0.3% for the month. Retail sales without gasoline station sales considered would have been a 0.2% monthly increase. Retail sales overall have increased 2.3% from a year ago. Nonstore (online) retailers have shot up by 14.1% and while gasoline has dropped by -11.0% for the year. Overall retail sales are not a good sign for consumer spending growth.

Total July retail sales were $457.7 billion. Below are the retail sales categories monthly percentage changes. General Merchandise includes Walmart, super centers, Costco and so on. Department stores by themselves declined by -0.5% for the month. Grocery stores by themselves plunged with a -0.9% monthly decrease. Sporting goods, hobby, book and music stores had a really bad month, -2.2% change in sales. Health and personal care had a 0.1% increase for the month but has soared up by 7.8% for the year. Online shopping continues to increase with a whopping 1.3% monthly gain and an annual one of 14.1%. One has to wonder if the increase in online shopping story is correlated with less demand in gasoline. These figures are seasonally adjusted.
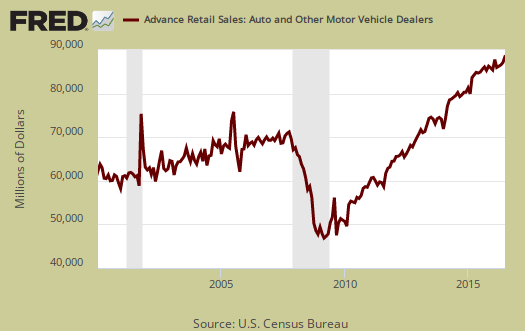
Below is a graph of just auto sales. For the year, motor vehicle sales have increased just 2.9%, even though the month showed a 1.3% increase Autos & parts together increased 1.1% for the month and 2.4% from a year ago.
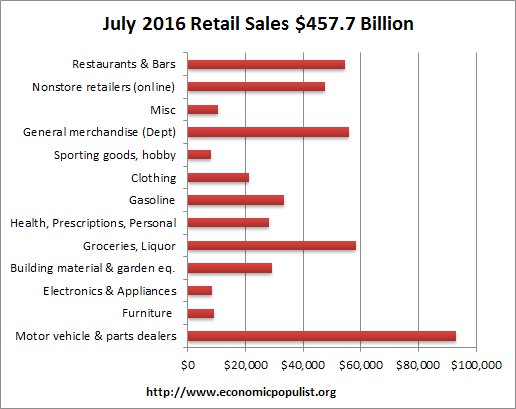
Below are the retail sales categories by dollar amounts. As we can see, autos are by far the largest amount of retail sales. By volume, auto dealers by themselves were $86 billion of sales. Grocery stores by themselves are $52.1 billion. Compare that to online sales, which were $47.7 billion and gas at $33.3 billion. We're sorry but Amazon prime day did not ruin retail sales as some in the press claim. Even though online sales are growing, it is clear by volume autos then groceries rule retail and the increase in online does not equate to a decrease in other retailers.
Graphed below are weekly regular gasoline prices, which is strongly correlated to retail sales figures. We can see how prices have decreased again of recent.

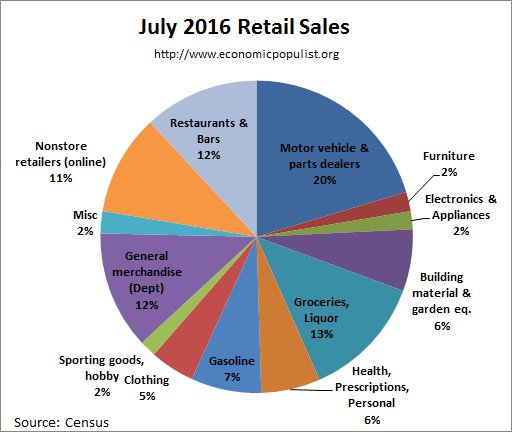
The below pie chart breaks down the monthly seasonally adjusted retail sales by category as a percentage of total sales by dollar amounts. The ratios of what people buy retail have been fairly stable, with online shopping taking more and more of a bite, but here too we can see the car is king in terms of the retail sales pie.
Retail sales correlates to personal consumption, which in turn is about 70% of GDP growth. Yet GDP has inflation removed from it's numbers. This is why Wall Street jumps on these retail sales figures. That said, retail sales is just a small part of personal consumption expenditures. The last month, June of real retail sales was 190.1 billion. Below is the graph of retail sales in real dollars, or adjusted for inflation.

While in no way do retail sales equal consumer spending in the United States, there is a strong correlation of trend. Below is a graph of real PCE against real retail sales, quarterly, up to Q2 2016. See how closely the two track each other? PCE almost looks like a low pass filter, an averaging, removal of "spikes", of real retail sales.

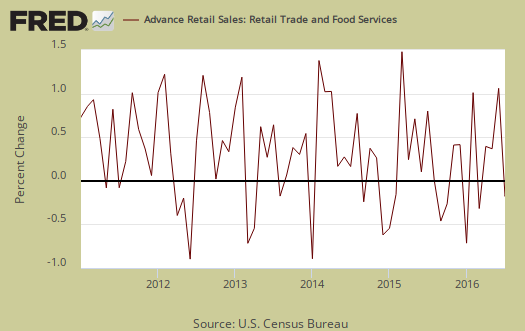
July retail sales are not adjusted for price increases, not reported in real dollars. Real economic growth adjusts for inflation. Retail sales has variance, margins of error, and is often revised as more raw data comes into the U.S. Department of Commerce (Census division). For example, this report has an error margin of ±0.5%. Data is reported via surveys, and is net revenues of retail stores, outlets. Online retail net revenues are asked in a separate survey of large retail companies (big box marts). This is also the advanced report. To keep the monthly nominal percentage changes in perspective, below is the graph of monthly percentage changes of retail sales since 2011.
For the three month moving average, from May to July in comparison to the February to April average, retail sales have increased by 1.4%. The retail sales three month moving average in comparison to a year ago is 2.5%. Overall as shown the below graph of quarterly annualized retail sales percentage change, up to Q2 2016.

Overall retail sales point to softness. It could be that prices have simply dropped and that surely needed to happen with soaring meat prices and so on, yet it is doubtful that price changes are responsible for the across the board weakness. People moving more and more to online retailers, we wonder if the category breakdowns are not quite right anymore. If I buy a toaster online at Walmart does that count as online or does it count as general merchandise? Also, advance reports almost always are revised the next month as more raw sales data is collected by the Census and many other elements to the economy go into GDP, retail sales is not the end all, be all metric, in spite of what Wall Street thinks.
Here are past retail sales overviews, not revised.
Recent comments