September 2014 Retail Sales decreased -0.3% for the month. August was revised to a 0.6% increase. Retail sales have now increased 4.3% from a year ago. September's decline was due to autos and gas, yet many sales categories were down for the month. Even Online retailers declined while Electronics and Appliance stores had an unusual 3.4% monthly increase. Retail sales are reported by dollars, not by volume with price changes removed.

Retail trade sales are retail sales minus food and beverage services and these sales decreased -0.4% for the month.. Retail trade sales includes gas.
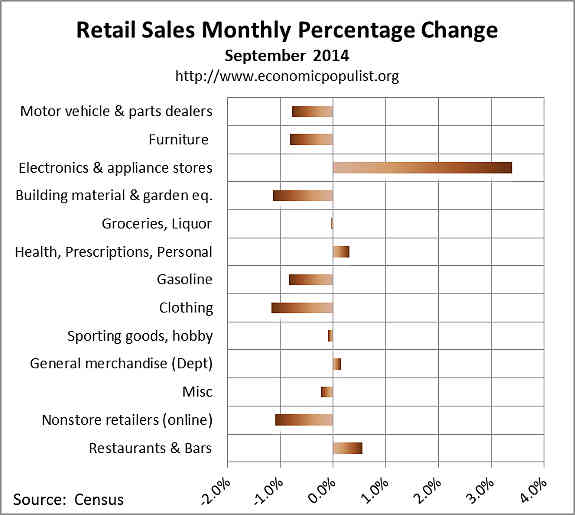
Total retail sales are $442.7 billion for September. Below are the retail sales categories monthly percentage changes. These numbers are seasonally adjusted. General Merchandise includes super centers, Costco and so on.
Below is a graph of just auto sales. We see how the recession just decimated auto sales and also how autos have a 10.4% increase for the year. Budget cuts and government shutdown games can impact auto sales as governments use large fleets of autos and trucks. Autos have been going strong and one month's decline does not a trend make.

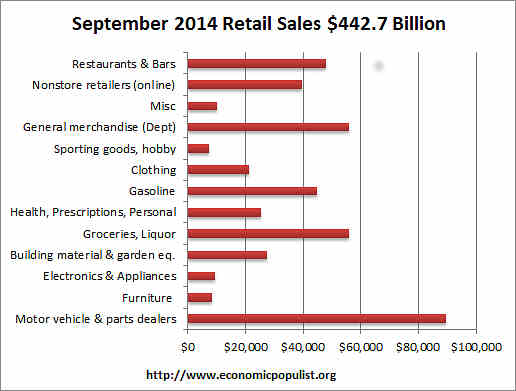
Below are the retail sales categories by dollar amounts. As we can see, autos rule when it comes to retail sales. We also see online retailers are really making a dent in their importance to the economy.
Graphed below are weekly regular gasoline prices, so one can see what happened to gas prices in September. Believe this or not, but gasoline station sales are down -2.5% from a year ago.

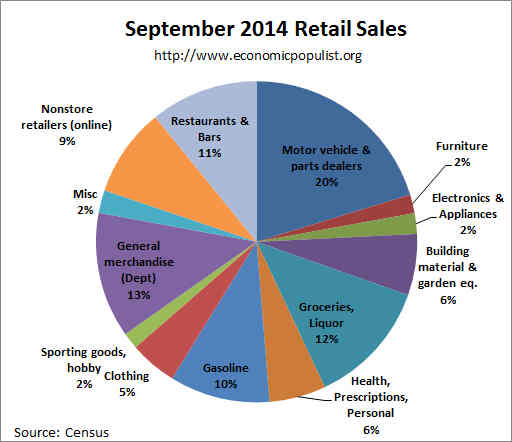
The below pie chart breaks down the monthly seasonally adjusted retail sales by category as a percentage of total September sales by dollar amounts. One can see how dependent monthly retail sales are on auto sales by this pie chart. We also see non-traditional retailers making strong grounds on traditional general merchandise stores and almost equal to gasoline sales in terms of importance.
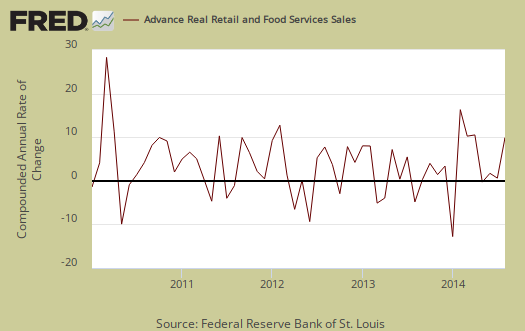
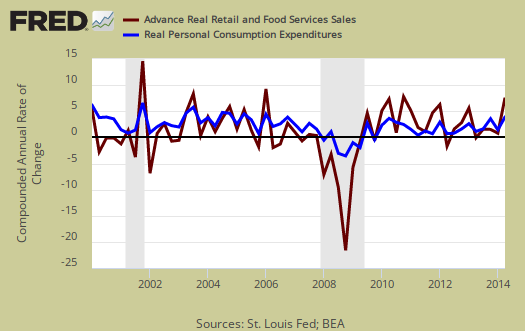
Retail sales correlates to personal consumption, which in turn is about 70% of GDP growth. Yet GDP has inflation removed from it's numbers. This is why Wall Street jumps on these retail sales figures. Below is the graph of retail sales in real dollars, or adjusted for inflation, so one gets a sense of volume versus price increases. Below is the annualized monthly percentage change in real retail sales, monthly, up to August 2014. This is a crude estimate since CPI is used instead of individual category inflation indexes. The below graph can give some insight as to what consumer spending might shape up to be for Q3 2014.
Below is a graph of real PCE against real retail sales, quarterly, up to Q2. See how closely the two track each other? PCE almost looks like a low pass filter, an averaging, removal of "spikes", of real retail sales. Here are our overviews for PCE. Here are our overviews of GDP.
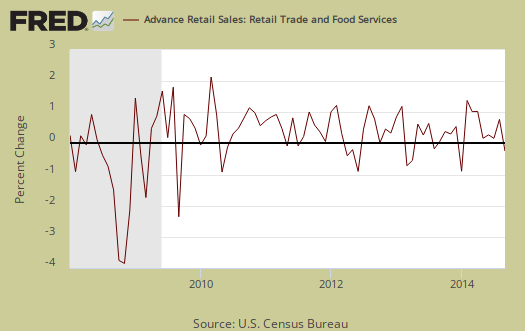
Retail sales are not adjusted for price increases, not reported in real dollars. Real economic growth adjusts for inflation. Retail sales has variance, margins of error, and is often revised as more raw data comes into the U.S. Department of Commerce (Census division). For example, this report has an error margin of ±0.5%. Data is reported via surveys, and is net revenues of retail stores, outlets. Online retail net revenues are asked in a separate survey of large retail companies (big box marts). This is also the advanced report. To keep the monthly nominal percentage changes in perspective, below is the graph of monthly percentage changes of retail sales since 2008.
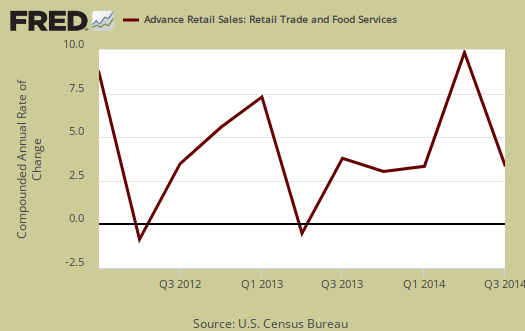
For the three month moving average, from July to September in comparison to April to June, retail sales have increased by1.0%. Gasoline looks like the culprit, and fluctuating prices might also be distorting the view. ;The retail sales three month moving average in comparison to a year ago are up 4.5%. Overall as shown the below graph of quarterly annualized retail sales percentage change, up to Q3 2014. &nsp;We believe gas prices have much to do with the drop so the below graph is probably much more scary than what real retail sales will be for Q3.
Seasonal adjustments are aggregate and based on events like holidays associated with shopping, i.e. the Christmas rush. Advance reports almost always are revised the next month as more raw sales data is collected by the Census. In other words, do not get married to these figures, they will surely be revised. Here is our retail sales topic category.
Here are past retail sales overviews, unrevised.

a quick and dirty analysis
although the 3rd quarter increase is overall retail sales was a comparatively weak 1.0%, especially when contrasted to the 2.3% growth in retail sales that we saw in the 2nd quarter, we have to remember that before retail sales are included in the personal consumption expenditures (PCE) component of GDP, they must first be adjusted for inflation...the BEA uses equivalent components of the consumer price index to do that, and CPI inflation ran more than 1.1% over the second quarter, reducing 2nd quarter PCE by an equivalent amount ...so far in the 3rd quarter, the CPI was up 0.1% in July but down 0.2% in August...if the negative results from the producer price index are any indication, consumer inflation should also be flat in September, possibly resulting in a negative deflator for PCE in the third quarter...if that is the case, the goods components of PCE may well contribute more to GDP in the third quarter than they did in the second...
rjs
August sales revisions
the revised August sales of $444.1 billion were originally reported at $444.4 billion, and July's sales were revised down from $441.8 billion to $441.5 billion..
although the overall 0.6% increase in August retail sales went essentially unrevised, there were revisions in sales for some of the component business types worth noting...the table of component changes from last month's advance release is here; the middle two columns in the table here show the revised data...we'd first note that August sales at auto dealers, the largest component of retail sales, were revised from the originally reporting 1.5% increase to an increase of 2.0%, although the entire automotive sales increase was a bit less at 1.9%...clothing store sales wee also revised higher, from the originally reported 0.3% rise to an increase of 0.8%, and sales at general merchandise stores, which were originally reported as down 0.1%, have been revised to show a 0.3% increase...on the other hand, sales at building materials and garden supply stores, which were originally reported as up 1.4% in August, have now been revised to an increase of just 0.5%...similarly, sales at miscellaneous store retailers, which were first reported as 2.5% higher in August, have been revised down to a 1.5% increase...other notable downward revisions include furniture store sales, reported as a 0.7% increase in the advance report, are now revised to a 0.3% rise; specialty store sales, as sporting goods, book and music stores, were also revised down 0.4%, from an increase of 0.9% to an increase of 0.4%, while the decrease in gasoline station sales is now shown at 1.1%, rather than the 0.8% decrease shown in the advance report, and the increase in drug stores sales was marked down from 0.6% to 0.3%...
rjs