
The April 2011 U.S. trade deficit decreased -$3.1 billion to $43.7 billion. This is a -6.7% monthly drop in the trade deficit and the largest since October 2010. Exports were the highest on record. Oil imports were the highest on record and the drop in imports from Japan also was the largest decrease on record. The tsunami hit Japan on March 11th.
The March 2011 monthly trade deficit was revised downward by -$1.4 billion to $46.8 billion. $26.1 billion of the April goods trade deficit is oil related, $4.2 billion less than 1 month ago, and 45.6% of the total goods trade deficit. Services have surplus of $14.4 billion and increased $0.2 billion last month.
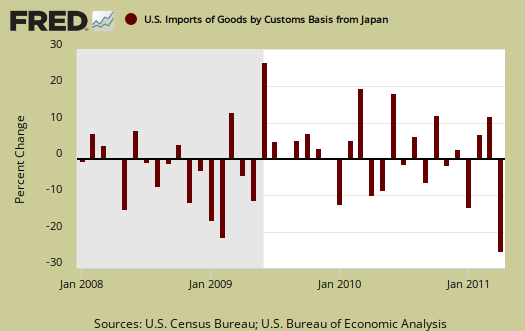
The below graph shows the monthly percentage change in Japanese imports, not seasonally adjusted. Which is worse, a devastating earthquake, tsunami and corresponding nuclear disaster greater than Chernobyl, or the financial crisis? Amazing how close the two are in percentage drops. The April 2011 decline was -25.5%, and from the recession, the February 2009 drop was -21.5%.
The United States basically has two major ongoing problems with the trade deficit, Chinese goods and Oil imports. Below is the not seasonally adjusted import price index for oil fuel. Look at the pattern and how the index is shooting up like a rock to rival 2008.

The March to April 2011 increase in average price per barrel of crude oil ($9.42) was the highest since the May to June 2008 increase ($10.85).
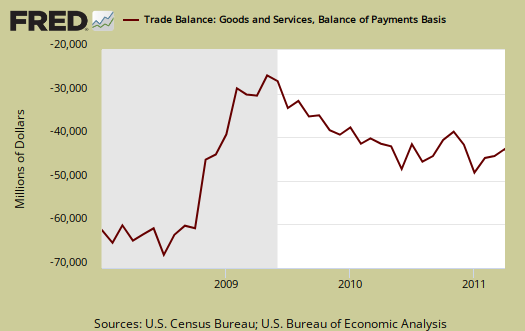
Below are imports vs. exports of goods and services from January 2007 to April 2011. Notice how much larger imports are than exports, but also notice the growth, or rate of change between months of U.S. exports.
April exports of goods ($126.4 billion) and exports of services ($49.1 billion) were the highest on record.

Below is the list of good export increases from March to April, seasonally adjusted. This month had a series of records on exports. Goods, capital goods, petroleum and Industrial supplies, which includes oil and petroleum related products, all hit record highs.
- Automotive vehicles, parts, and engines: -$0.77 billion
- Industrial supplies and materials: +$2.04 billion
- Other goods: -$0.45 billion
- Foods, feeds, and beverages: -$0.20 billion
- Capital goods: +$1.24 billion
- Consumer goods: +$0.26 billion
Exhibit 7 gives Census accounting method breakdown for exports.
Here are the goods import monthly changes, seasonally adjusted, with foods imports hitting $8,97 billion in a month, a record high. Notice the dramatic decline in Automotive imports. This can be attributed to the Japan disaster.
- Industrial supplies and materials: -$1.51 billion
- Capital goods: +$0.56 billion
- Foods, feeds, and beverages: +$0.36 billion
- Automotive vehicles, parts, and engines: -$2.82 billion
- Consumer goods: -$2.09 billion
- Other goods: +$0.21 billion
Running a trade deficit in advanced technology is not a good sign for those jobs of tomorrow and this deficit is increasing:
Advanced technology products exports were $23.0 billion in April and imports were $30.1 billion, resulting in a deficit of $7.0 billion. April exports were $2.2 billion less than the $25.3 billion in March, while April imports were $2.1 billion less than the $32.2 billion in March.
Here is the breakdown with major trading partners, not seasonally adjusted. China is the worst trade deficit, with $21.6 billion, with last month's China deficit being $18.1 billion.
OPEC, which is oil, decreased, but these numbers are not seasonally adjusted. The amounts in parenthesis are March's deficit figures.
The April figures show surpluses, in billions of dollars, with Hong Kong $2.6 ($2.7 for March), Singapore $1.2 ($0.9), Australia $1.1 ($1.1), and Egypt $0.5 ($0.4).
Deficits were recorded, in billions of dollars, with China $21.6 ($18.1), OPEC $9.6 ($10.8), European Union $7.5 ($9.0), Mexico $5.5 ($6.2), Germany $3.8 ($4.6), Japan $3.6 ($6.1), Ireland $3.0 ($2.6), Venezuela $2.8 ($3.0), Nigeria $2.5 ($2.5), Canada $2.5 ($2.6), Taiwan $1.2 ($0.6) and Korea $1.0 ($0.6).
Here is a highlight on the trade situation with Japan:
The goods deficit with Japan decreased from $6.1 billion in March to $3.6 billion in April. Exports decreased $0.5 billion (primarily metallurgical grade coal, medicinal equipment, and organic chemicals) to $5.2 billion, while imports decreased $3.0 billion (primarily automobiles, parts and accessories and computer accessories) to $8.8 billion.
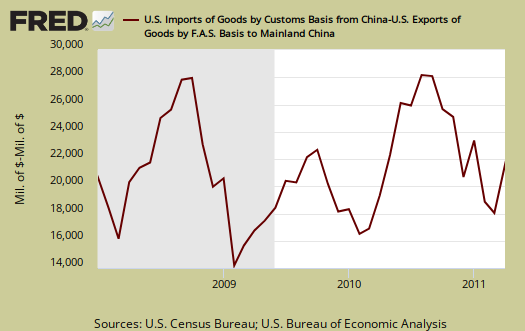
Below is the raw customs basis accounting of the trade deficit with China, not seasonally adjusted. China alone is 40% of the goods trade deficit for April.
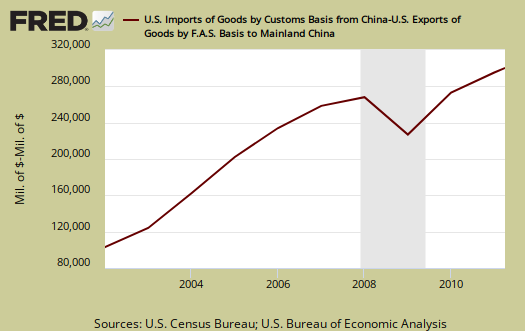
Below is a graph of trade deficit with China, per year. 2010 was a record for a trade deficit with China.
Here is March's report (unrevised, although graphs are updated). Here is the BEA website for additional U.S. trade data.
You might ask what are these Census Basis versus Balance of Payment mentioned all over the place? The above mentions various accounting methods so we're comparing Apples to Apples and not mixing the fruit. The trade report in particular is difficult due to the mixing of these two accounting methods and additionally some data is seasonally adjusted and others are not. One cannot compare values from different accounting methods and have that comparison be valid.
In a nutshell, the Balance of Payments accounting method is where they make a bunch of adjustments to not count imports and exports twice, the military moving stuff around or miss some additions such as freight charges. The Census basis is more plain raw data the U.S. customs people hand over which is just the stuff crosses the border. The 2005 chain weighted stuff means it was overall modified for a price increase/decrease adjustment in order to remove inflation and deflation time variance stuff.
Bottom line, you want just the raw data of what's coming into the country and going out, it's the Census basis and additionally the details are only reported in that accounting format.
The Census is also getting into the graphing game with some nice pie charts breaking down exports by country, as well as a chart showing petroleum as an overall percentage of the trade deficit. No surprise China eats the pie on goods imports, yet where oil is on their chart is a mystery due to not showing OPEC grouped.
Recent comments