
The August 2011 U.S. trade deficit increased $17 million to $$45.61 billion. This is no change (0.037%) from last month in the trade deficit. July's trade deficit was revised up slightly from $44.8 billion. Exports decreased by $95 million, or no change, while imports decreased $100 million, or 0%. The China-U.S. trade deficit, not seasonally adjusted, increased 7.42% in August and is a new record high, $29 billion for the month.

Below is the raw customs basis accounting of the trade deficit with China, not seasonally adjusted. China alone was 41.41% of the goods trade deficit for August. This includes oil. For comparison's sake the not seasonally adjusted goods trade deficit by Census accounting methods was $69.93 billion.
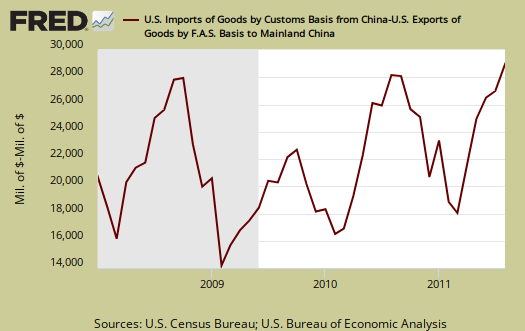
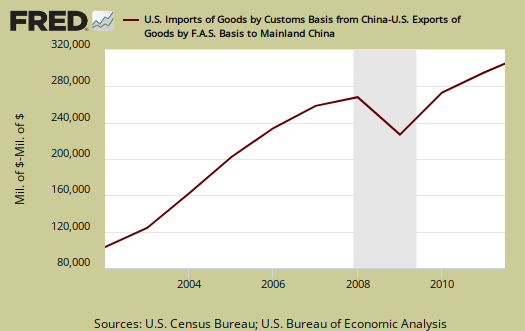
For the 2011 year to date, the trade deficit with China is $189.32 billion. China is 39.2% of the total goods accumulated trade deficit, which again includes petroleum imports on aggregate. The trade deficit with China for 2011 has already exceeded the August 2010 accumulated China-U.S. trade deficit of $173.53 billion by $15.8 billion or 9.1%. We have 4 months to go for 2011. The record trade deficit for China of 2010 was $273.063 billion. Assuming $26 billion for the next 4 months, assuming the same cyclical pattern of 2010, of monthly trade deficits with China, we're looking at a $293 billion 2011 China-U.S. trade deficit. The annual China-US trade deficit is graphed below.
Oil related imports increased $745 million with a petroleum end use trade deficit of $26.06 billion, for August, or 43.2% of the goods trade deficit, and a monthly increase of 1.25%. This is essentially another flat line change from July.
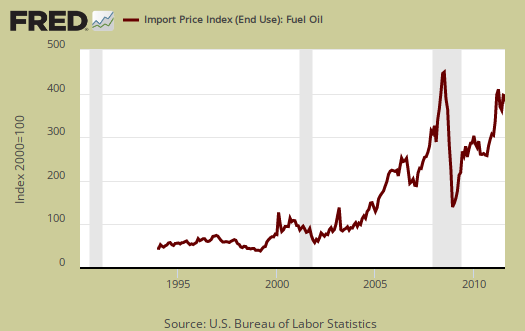
The United States basically has two major ongoing problems with the trade deficit, Chinese goods and Oil imports. Below is the not seasonally adjusted import price index for oil fuel. In August the average price for a barrel of oil was $102.62, down from July's price of $104.27.
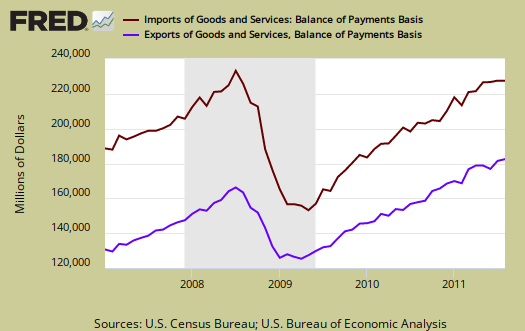
Below are imports vs. exports of goods and services from January 2007 to June 2011. Notice how much larger imports are than exports, but also notice the growth, or rate of change between months of U.S. exports over time. To state the obvious, imports subtract from GDP.
Below is the list of good export increases from July to August, seasonally adjusted. Industrial supplies and materials exports, which includes fuel oil. You can see how flat the change was for this month, nothing registered a billion in change.
- Automotive vehicles, parts, and engines: -$0.989 billion
- Industrial supplies and materials: +$0.779 billion
- Other goods: +$0.133 billion
- Foods, feeds, and beverages: +$0.22 billion
- Capital goods: -$0.364 billion
- Consumer goods: +$0.241 billion
Exhibit 7 gives Census accounting method breakdown for exports.
Here are the goods import monthly changes, seasonally adjusted. Again, nothing broke $1 billion except crude oil, an increase of $1.813 billion, which is part of Industrial Supplies.
- Industrial supplies and materials: +$0.905 billion
- Capital goods: -$0.264 billion
- Foods, feeds, and beverages: +$0.056 billion
- Automotive vehicles, parts, and engines: -$0.732 billion
- Consumer goods: -$0.784 billion
- Other goods: +$0.899 billion
Running a trade deficit in advanced technology is not a good sign for those jobs of tomorrow. This month was also no change. The advanced technology trade deficit usually increases almost every month, meaning we are literally outsourcing America's future.
Advanced technology products exports were $23.9 billion in August and imports were $33.0 billion, resulting in a deficit of $9.1 billion. August exports were $0.3 billion more than the $23.6 billion in July, while August imports were $0.3 billion more than the $32.7 billion in July.
Here is the breakdown with major trading partners, not seasonally adjusted. China is the worst trade deficit, with $29 billion. We are China's export dumping ground.
OPEC can be assumed to be oil and it increased for July, but is not seasonally adjusted. The OPEC nations are: Algeria, Angola, Ecuador, Iran, Iraq, Kuwait, Libya,
Nigeria, Qatar, Saudi Arabia, United Arab Emirates, Venezuela. OPEC accounts for about 53% (customs basis), of all crude oil imports by nation and is 19% of the total goods trade deficit this month. Still we see every month, our problem is clearly China and oil imports. The amounts in parenthesis are July's deficit figures. Notice how the trade surplus list is super short.
The August figures show surpluses, in billions of dollars, with Hong Kong $2.4 ($2.3 for July), Australia $1.4 ($1.7), Singapore $1.0 ($1.2), and Egypt $0.4 ($0.4).
Deficits were recorded, in billions of dollars, with China $29.0 ($27.0), OPEC $13.3 ($11.9), European Union $9.0 ($8.9), Japan $6.7 ($5.2), Mexico $5.5 ($4.9), Germany $4.5 ($4.2), Venezuela $3.0 ($2.6), Nigeria $3.0 ($2.8), Ireland $2.9 ($2.7), Canada $2.4 ($3.3), Taiwan $1.6 ($1.6), and Korea $0.7 ($1.4).
In 2008, we broke monthly total trade deficit figures of $60 billion. This includes goods and services.
Here is July's report overview (unrevised, although graphs are updated). Here is the BEA website for additional U.S. trade data.
You might ask what are these Census Basis versus Balance of Payment mentioned all over the place? The above mentions various accounting methods so we're comparing Apples to Apples and not mixing the fruit. The trade report in particular is difficult due to the mixing of these two accounting methods and additionally some data is seasonally adjusted and others are not. One cannot compare values from different accounting methods and have that comparison be valid.
In a nutshell, the Balance of Payments accounting method is where they make a bunch of adjustments to not count imports and exports twice, the military moving stuff around or miss some additions such as freight charges. The Census basis is more plain raw data the U.S. customs people hand over which is just the stuff crosses the border. The 2005 chain weighted stuff means it was overall modified for a price increase/decrease adjustment in order to remove inflation and deflation time variance stuff.
Bottom line, you want just the raw data of what's coming into the country and going out, it's the Census basis and additionally the details are only reported in that accounting format. Additionally the per country data is not seasonally adjusted so watch out trying to add those numbers into the overall trade deficit. It's a statistical no-no to mix seasonal and non-seasonally adjusted numbers.
The Census is also getting into the graphing game with some nice pie charts breaking down exports by country, as well as a chart showing petroleum as an overall percentage of the trade deficit.
Recent comments