
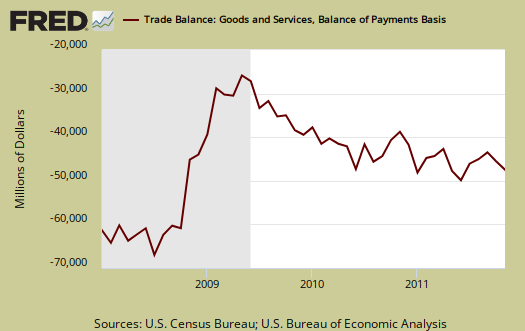
The November 2011 U.S. trade deficit jumped $4.48 billion to $47.8 billion in a month. This is a 10.36% deficit increase from last month in the trade deficit. October's trade deficit was revised down slightly by $195 million. Exports decreased -$1.54 billion, or -0.86%, while imports increased $2.95 billion, or +1.32%. The goods only trade deficit was -$60.42 billion. Services runs a surplus of $15.43 billion.
Below is the raw customs basis accounting of the trade deficit with China, not seasonally adjusted. China alone was, -$26.87 billion, or 41.67% of the goods trade deficit for November. This includes oil. For comparison's sake the not seasonally adjusted goods trade deficit by Census accounting methods was -$64.48 billion.
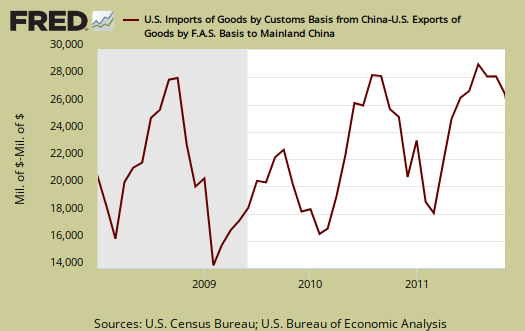
For the 2011 year to date, the trade deficit with China is -$272,32 billion. With one month to go of trade data, all December needs to do is hit a monthly China trade deficit of $27.7 billion, and we'll be running a $300 billion dollar annual trade deficit with China. The record trade deficit for China of 2010 was $273.06 billion. Regardless of the psychology of $300 billion, the U.S.-China trade deficit is guaranteed to exceed last year's record.

Oil related imports increased +$3.24 billion with a petroleum end use trade deficit of -$27.63 billion, for November. Petroleum related end use is 43.73% of the goods trade deficit. The Petroleum related trade deficit jumped 13.41% from last month.
By the more specific to import types NAICS codes, not seasonally adjusted, oil and gas were 35.2% of the goods trade deficit, or $22.12 billion. Assuming China has very little oil and gas exports to the United States, if one subtracts off oil and gas from the goods trade deficit, China becomes very roughly 66% of the non-oil and gas goods trade deficit.
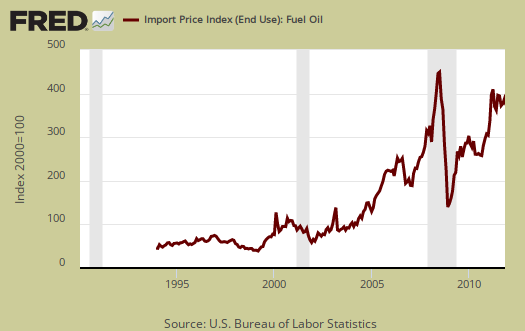
The United States basically has two major ongoing problems with the trade deficit, Chinese goods and Oil imports. Below is the not seasonally adjusted import price index for oil fuel. The average price for a barrel of oil in November was $102.50, up from October's price of $98.84. This explains the increase in petroleum related imports and thus the increase in this month's trade deficit. The petroleum related trade deficit increase was $3.47 billion from last month.
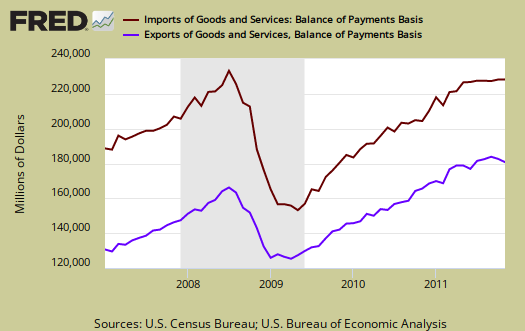
Below are imports vs. exports of goods and services from January 2007 to November 2011. Notice how much larger imports are than exports, but also notice the growth, or rate of change between months of U.S. exports over time. To state the obvious, imports subtract from GDP and exports add.
Below is the list of good export decreases from October to November, seasonally adjusted. Of industrial supplies we saw a -$891 million export drop in non-monetary gold. All exports categories declined except consumer goods. There we have pharmaceuticals as exports and believe this or not, a $277 million export increase in artwork, stamps and antiques. Good god, America is having a garage sale.
- Automotive vehicles, parts, and engines: -$0.214 billion
- Industrial supplies and materials: -$1,627 billion
- Other goods: -$0.237 billion
- Foods, feeds, and beverages: -$0.065 billion
- Capital goods: -$0.249 billion
- Consumer goods: +$0.804 billion
Exhibit 7 gives Census accounting method breakdown for exports.
Here are the goods import monthly changes, seasonally adjusted. Crude oil increased $1.733 billion, fuel oil bumped up $0.487 billion and other petroleum related imports increased +$1.035 billion. While we imported $28.59 in crude oil, auto related imports were $22.29 billion, almost as much as our needed black gold.
- Industrial supplies and materials: +$2.719 billion
- Capital goods: +$0.126 billion
- Foods, feeds, and beverages: -$0.115 billion
- Automotive vehicles, parts, and engines: +$0.816 billion
- Consumer goods: -$0.682 billion
- Other goods: +$0.585 billion
Running a trade deficit in advanced technology is not a good sign for those jobs of tomorrow. This month the advanced technology deficit had another increase of 2.84%. China, again was -$11.464 billion of this deficit, with the entire Pacific Rim deficit being -$12.402 billion. The advanced technology trade deficit usually increases almost every month, meaning we are literally outsourcing America's future. The advanced technology trade data is not seasonally adjusted.
Advanced technology products exports were $24.9 billion in November and imports were $35.7 billion, resulting in a deficit of $10.7 billion. November exports were $0.5 billion less than the $25.5 billion in October, while November
imports were $0.2 billion less than the $35.9 billion in October.
Here is the breakdown with major trading partners, not seasonally adjusted. China is the worst trade deficit, yet dropped -$1.2 billion. That said, since country trade data is not seasonally adjusted, we do see cyclical rises and falls in these numbers. This monthly change does not mean China has magically started to balance their trade.
OPEC can be assumed to be oil and it increased $0.8 billion for November, but is not seasonally adjusted. The OPEC nations are: Algeria, Angola, Ecuador, Iran, Iraq, Kuwait, Libya, Nigeria, Qatar, Saudi Arabia, United Arab Emirates, Venezuela. OPEC accounts for about 46.8% (customs basis), of all crude oil imports by nation for November.
The trade deficit with all of Europe increased $2.45 billion in November. Exports to Europe dropped -$1.82 billion while European imports increased $0.63 billion. These numbers are not seasonally adjusted but it appears the grand European crisis affected U.S. exports.
The November figures show surpluses, in billions of dollars, with Hong Kong $3.2 ($3.0 for October), Australia $1.5 ($2.1), Singapore $1.0 ($1.0), and Egypt $0.1 ($0.2).
Deficits were recorded, in billions of dollars, with China $26.9 ($28.1), European Union $9.7 ($8.0), OPEC $9.1 ($8.3), Japan $6.2 ($6.2), Mexico $5.5 ($5.3), Germany $4.7 ($4.3), Canada $3.0 ($2.2), Ireland $2.8 ($2.8), Nigeria $2.3 ($1.9), Venezuela $1.9 ($2.3), Taiwan $1.4 ($1.7), and Korea $1.3 ($1.4).
In 2008, we broke monthly total trade deficit figures of $60 billion. This includes goods and services.
Here is October's report overview (unrevised, although graphs are updated). Here is the BEA website for additional U.S. trade data.
You might ask what are these Census Basis versus Balance of Payment mentioned all over the place? The above mentions various accounting methods so we're comparing Apples to Apples and not mixing the fruit. The trade report in particular is difficult due to the mixing of these two accounting methods and additionally some data is seasonally adjusted and others are not. One cannot compare values from different accounting methods and have that comparison be valid.
In a nutshell, the Balance of Payments accounting method is where they make a bunch of adjustments to not count imports and exports twice, the military moving stuff around or miss some additions such as freight charges. The Census basis is more plain raw data the U.S. customs people hand over which is just the stuff crosses the border. The 2005 chain weighted stuff means it was overall modified for a price increase/decrease adjustment in order to remove inflation and deflation time variance stuff.
Bottom line, you want just the raw data of what's coming into the country and going out, it's the Census basis and additionally the details are only reported in that accounting format. Additionally the per country data is not seasonally adjusted so watch out trying to add those numbers into the overall trade deficit. It's a statistical no-no to mix seasonal and non-seasonally adjusted numbers.
The Census is also getting into the graphing game with some nice pie charts breaking down exports by country, as well as a chart showing petroleum as an overall percentage of the trade deficit.
Trade Policy is The Problem, Not China
"The United States basically has two major ongoing problems with the trade deficit, Chinese goods and Oil imports."
One would get this impression if you simply look at the dollars involved in the trade deficit. However, it's wrong to single out China. When expressed in per capita terms, our trade deficit in manufactured goods with China barely makes the list of our top 20 deficits. Our per capita deficit in manufactured goods with Japan, Germany, South Korea, Mexico and a host of others is much worse. Our trade deficit with China is exactly what we should have expected when we applied to them, a nation with one fifth of the world's population, the same trade policy that was already a proven failure all around the world.
The problem isn't China. It's our own trade policy. Our free trade policy is based upon an early 19th century theory that fails to account for the role of disparities in population density in driving global trade imbalances. The field of economics has failed to recognize the inverse relationship between population density and per capita consumption and its ramifications for trade between nations grossly disparate in population density.
Until we revise our trade policy to one rooted in economic realities, nothing will improve. Singling out China for sanctions will only open the door to some other badly overpopulation nation deperate to put its bloated labor force to work - India, perhaps - to rush in and fill the void. We need a tariff structure on manufactured goods that is indexed to population density.
Pete Murphy
Author, "Five Short Blasts"
macro economics isn't per capita
National economies are not per capita and even if they were, I doubt $300 billion divided by 1.4 billion people is not the largest trade deficit.
I notice you aren't making oil per capita here.
Macro economics doesn't do per capita because despite some philosophies, this is not a global village, it's a collection of nation-states. Each nation-state has it's own currency, laws, borders and domestic economies.
It's not America's fault some countries are way over populated, but regardless, international trade doesn't scale per capita like say consumer spending or personal income will.
China is a problem and that does imply the U.S. should change the current China PNTR and a host of other actions.
We already have a problem with India and services but we're not here to take care of the world's overpopulation. We're here to increase and improve economic well being for Americans, America's middle class. We have more than enough problems in the U.S., incredible poverty, hunger, over a quarter of kids are growing up in poverty to list just a few, to even contemplate taking care of the globe's overpopulation. Beyond that, one cannot fix those problems we cannot impose our will on these other peoples. It's up to those cultures, nation-states parts of the world to address their own problems, especially one as sensitive as over population.