
The April 2011 monthly unemployment figures show the official unemployment rate increased to 9.0% and the total jobs gained were 244,000. Total private jobs came in at 268,000 with government jobs dropping -24,000.

Those entering not in the labor force increased by +131,000. The labor force participation rate was unchanged, 64.2%, the same as the previous three months. Those added to the civilian labor force was only +15,000, which is hard to believe. The noncivilian population increased by +146,000. This is the lowest labor participation rate since March 1984. U6, or the broader unemployment measurement, increased 0.2% to 15.9%, which correlates to U-3, of the official unemployment rate.
Below is the nonfarm payroll, the total number of jobs, seasonally adjusted. Since the start of the great recession, declared by the NBER to be December 2007, the United States has officially lost 6.955 million jobs. That does not take into account additional jobs needed to employ the United States increased population, but does include the jobs added over the over 3.33 year time period.

Below is a running tally of how many official jobs permanently lost since the official start of this past recession (recall the private NBER has declared the recession over!). This is a horrific tally and notice this isn't taking into account increased population growth, which implies the United States needs to create at least 10.71 million jobs. This estimate assume a 62.7% civilian non-institutional population to employment ratio, as it was in December 2007, which implies an additional 3.755 million jobs needed over a 3.33 month time period.

We get a new graph of the alternative unemployment measurement, U-6, posted below. Here you can see the incredible increase in comparison to the beginning of this broader unemployment measurement.

How can the unemployment rate increase? The official unemployed increased by 205,000, alternatively the employed dropped by -190,000, while the actual labor force only grew by 15,000. The employment to population ratio only dropped by a percentage point, to 58.4%.
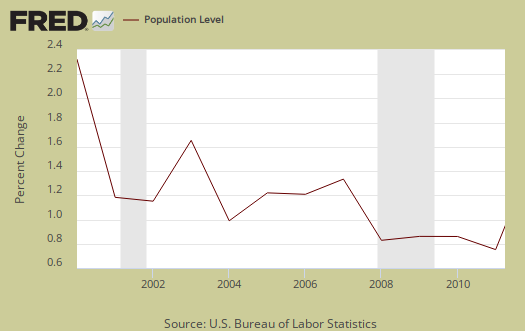
There were 244,000 jobs and civilian noninstitutional population only grew by 146,000 this month, which is a monthly growth deceleration. Below is an annualized graph of civilian institutional population. We see a deceleration of population growth. It's from this category of people that potential workers come from.
The civilian labor force increased by only +15,000. Of those still in the civilian labor force, employed, decreased by -190,000 in April , yet those unemployed increased by +205,000. We see this reflected in the uptick in initial unemployment claims. Those not in the labor force increased by +131,000 in a month.
The civilian non-institutional population are those 16 years or older not locked up somewhere or not in the military or so sick and disabled they are in a nursing home and so on.

The increasingly low labor participation rate is now at 64.2%. If we go back to December 2007, the labor participation rate was 66%. The highest civilian labor participation rate was in January 2000, at 67.3%. What this means is there are almost 4.3 million people not be accounted for in the official unemployment rate who probably need a job and can't find one.

The employment to population ratio is now 58.4% which is at record lows. This isn't a structural change, such as all families decided to have a stay at home caretaker, or magically a host of people could retire early, this is people dropping out of the count.
These numbers are important because unemployment is a ratio, percentage or during a limited time period, the number of people actively looking for a job and counted. Many people are not counted in the official unemployment statistics, due to definitions, but obviously when one has more potential workers and less jobs, that metric doesn't bode well for America.

Below is the graph of the civilian non-institutional population, which is the largest super-set of the potential labor force, larger than the civilian workforce, due to those who are not looking for work, retired and so on being counted in this figure. This is why one must create jobs greater than the constant rate of jobs lost. There are more people to employ. Unemployment is a percentage, a ratio.
The BLS unemployment report counts foreign temporary guest workers as well as illegal immigrants in their U.S. labor force statistics.

One needs at least 98,000 and some estimate up to 375,000 permanent full time jobs, added each month just to keep pace with U.S. civilian workforce population growth. That's not general population, that's the group needing a job.
While this report now gives three months of solid job growth, bear in mind it's not enough. Don't let the press or the politicians trying to blind you into thinking America doesn't have a jobs crisis.
number crunch validation by Krugman
I just read Krugman's blog and he's got basically the same numbers I just crunched, we need almost 11 million jobs to break even.