
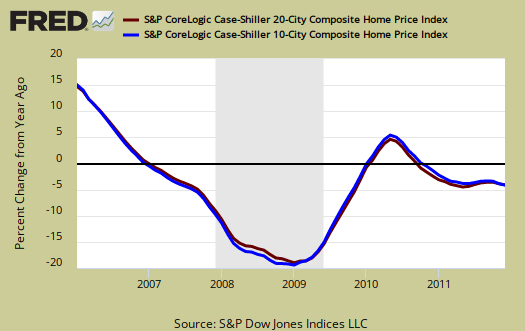
The S&P Case Shiller home price index shows a -4.0% decline from a year ago over 20 metropolitan housing markets and a -3.9% decline for the top 10 housing markets from December 2010. Home prices are back to early 2003 levels and new index lows. S&P itself has woken up and realized home prices have not yet reached a bottom.
Below is the yearly percent change in the composite-10 and composite-20 Case-Shiller Indices. These are not seasonally adjusted, but comparing from December 2010.
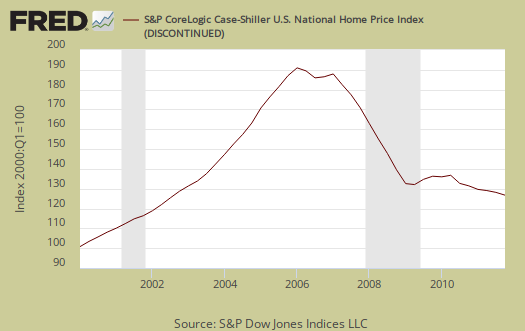
S&P also released the Q4 national index and reported the not seasonally adjusted quarterly index, which shows a -3.8% change from Q3 2011 and a -4.0% change from Q4 2010. Below is the seasonally adjusted national index which gives a -1.7% 2011 Q4 change from the previous quarter
Wondering why we have conflicting news headlines on the S&P Case-Shiller Housing Index? Because some in the press use the seasonally adjusted data, and others do not. S&P themselves use the not seasonally adjusted numbers for their headlines and press releases. To make matters worse, some compare just the monthly not seasonally adjusted data and others compare the housing price index to one year ago, without telling you what number they are quoting from S&P. That's why on this site we make sure you know which apple you're looking at, all data is identified.
This month the not seasonally adjusted November to December change for the composite-20 was -1.1%. The seasonally adjusted composite-20 monthly change was -0.5%. The composite-10 not seasonally adjusted monthly change was -1.1% and the seasonally adjusted composite-10 monthly change was -0.52%. Intuitively, the divergence of the seasonal adjustments in December makes sense. The housing season is over. Bottom line, anyway you look at the Case-Shiller numbers, single family housing prices declined.
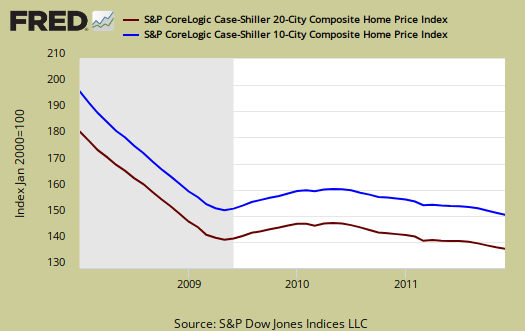
The above graph shows the composite-10 and composite-20 city home prices indexes, seasonally adjusted. Prices are normalized to the year 2000. The index value of 150 means single family housing prices have appreciated, or increased 50% since 2000 in that particular region. These indices are not adjusted for inflation. The composite-20 index, seasonally adjusted is 136.63
and comparable to January 2003 levels (ignoring 2009). Not seasonally adjusted the composite-20 index is 136.71, equal to February 2003 levels. Housing prices are going backwards in time.
The S&P/Case-Shiller Home Price Indices are calculated monthly using a three-month moving average and published with a two month lag. Their seasonal adjustment calculation is the standard used for all seasonal adjustments, the X-12 ARIMA, maintained by the Census.
So, why would S&P report the not seasonally adjusted data? According to their paper on seasonal adjustments, they claim the not seasonally adjusted indices are more accurate. Why? It appears the housing bubble burst screwed up the cyclical seasonal pattern. What a surprise.
The turmoil in the housing market in the last few years has generated unusual movements that are easily mistaken for shifts in the normal seasonal patterns, resulting in larger seasonal adjustments and misleading results.
Not seasonally adjusted data can create more headline buzz on a month by month basis due to the seasonality of the housing market. S&P does make it clear that data should be compared to a year ago, to remove seasonal patterns, yet claims monthly percentage changes should use not seasonally adjusted indices and data. This seems more invalid than dealing with the statistical anomalies the massive housing bubble burst caused. Below are the seasonally adjusted indices for December 2011.
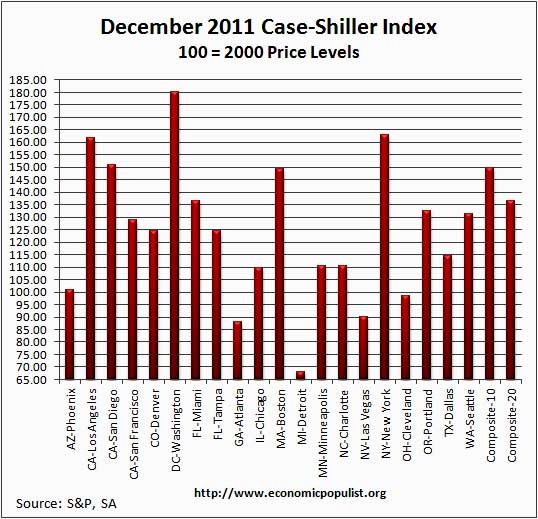
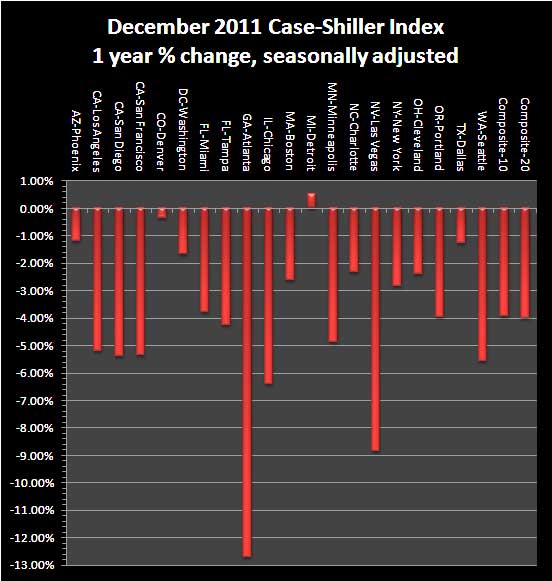
For December 2011, the S&P/Case-Shiller Home Price indexes, seasonally adjusted, shows 19 of the 20 cities tracked are down for the year. Only Detroit, squeaked positive, 0.53%, but bear in mind they have been hammered.
Below are all of the composite-20 index cities yearly price percentage change, using the seasonally adjusted data.
When it comes to annual data, the seasonally adjusted and not seasonally adjusted should start to converge. Here is S&P's comment on their figures, using the not seasonally adjusted data. Notice where the jobs are not is where prices are decreasing more. Some damning details from S&P, using the not seasonally adjusted data:
After a prior three years of accelerated decline, the past two years has been a story of a housing market that is bottoming out but has not yet stabilized. Up until today’s report we had believed the crisis lows for the
composites were behind us, with the 10-City Composite originally hitting a low in April 2009 and the 20-City Composite in March 2011. Now it looks like neither was the case, as both hit new record lows in December 2011. The National Composite fell by 3.8% in the fourth quarter alone, and is down 33.8% from its 2nd quarter 2006 peak. It also recorded a new record low.In general, most of the regions also posted weak data in December. Eighteen of the cities saw average home prices fall in December over November. Seventeen of the cities have seen monthly declines for at least three consecutive months. In addition to both monthly composites, 10 of the cities saw home prices fall by more than 1.0% during the month of December. The pick-up in the economy has simply not been strong enough to keep home prices stabilized. If anything it looks like we might have reentered a period of decline as we begin 2012.
For more analysis, we recommend Calculated Risk, who does correct, extreme analysis and graphing on Case-Shiller data.
S&P does a great job of making the Case-Shiller data and details available for further information and analysis on their website.
Here is our overview from last month.
Recent comments