
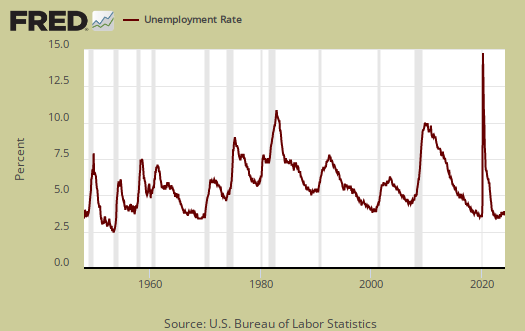
The May 2016 unemployment report on the surface sounds like great news. The unemployment rate dropped to an astoundingly low 4.7%. This is a -0.3 percentage point drop from last month and a level not seen since November 2007. Yet the statistics which make up the unemployment rate actually shows something terrible. The unemployment rate dropped because 664,000 people dropped out of the labor force with almost half a million no longer counted as unemployed. The labor participation rate dropped by -0.2 percentage points while the civilian participation rate did not change. One month is not a pattern , yet seeing record low participation rates is not the way to lower the unemployment rate. Many other economic indicators show a stalled economy and the unemployment appears to be catching up with the other first quarter bad economic news.
This article overviews and graphs the statistics from the Employment report Household Survey also known as CPS, or current population survey. The CPS survey tells us about people employed, not employed, looking for work and not counted at all. The household survey has large swings on a monthly basis as well as a large margin of sampling error. This part of the employment report is not about actual jobs gained but people and their labor status.
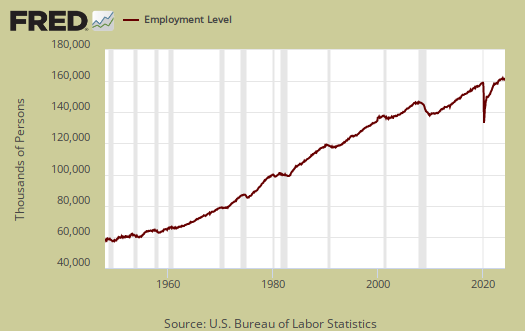
Those employed now stands at 151,030,000, a monthly increase of 26 thousand. From a year ago, the ranks of the employed has increased by 2.282 million. That's almost a quarter of a million less in annual gain than last month but still a very good showing for annual growth in employment.
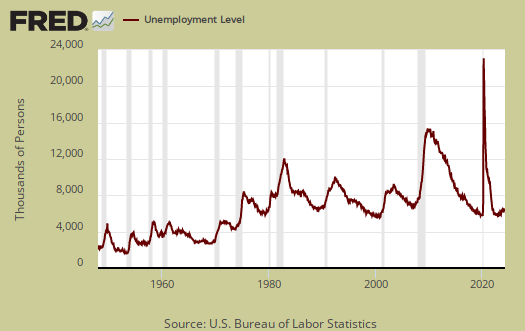
Those unemployed number 7,436,000, a monthly -484,000 decline. &nsp;In terms of percentages this is a whopping -6.1% monthly drop. From a year ago the unemployed has decreased by -1,183,000. Normally this would be a good thing, yet it is clear many are simply no longer participating in the labor force instead of finding a job.
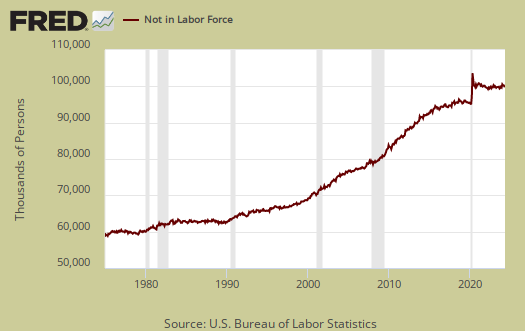
Those not in the labor force is 94.708 million. The monthly increase was an astounding 664,000. April's not in the labor force gain was 562,000. That means in two month's time the increase in those not participating in the American work life rose by 1.226 million. The below graph are the not in the labor force ranks. Those not in the labor force has increased by 1,619,000 in the past year, obviously the majority of that gain occurring in the past two months.
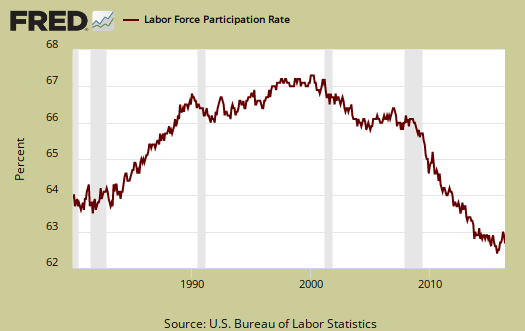
The labor participation rate is 62.6%. This is a -0.2 percentage point decrease from last month. Pre-recession, the January 2008 labor participate rate was 66.2% a far cry from what we see today. Ignoring labor participation rates after 2008, one has to go to the late 1977 to find rates this low.
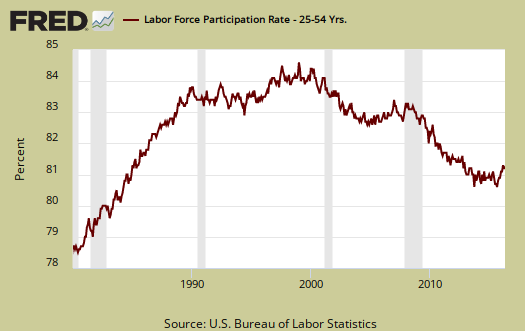
Below is a graph of the labor participation rate for those between the ages of 25 to 54, which decreased by -0.2 percentage points from last month. The rate is 81.0%, a level not seen since December 1984, discounting events after 2008. These are the prime working years where people are not in retirement or in school full time commonly, so one should not see record low participation rates, especially with an unemployment rate not seen for over eight years. In January 2008 the prime working years labor participate rate was 83.3%.
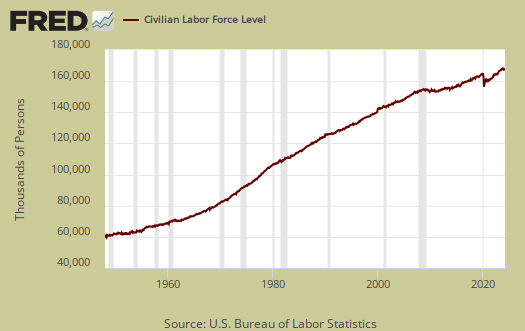
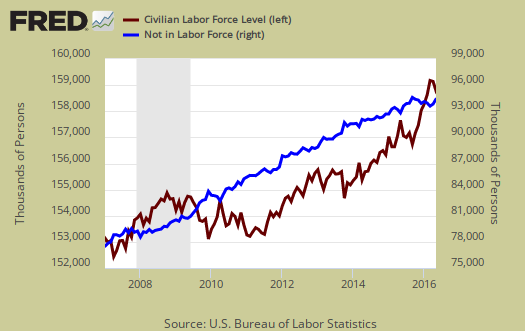
The civilian labor force, which consists of the employed and the officially unemployed, declined by -458,000 to stand at 158,466,000. The civilian labor force has grown by 1,099,000 over the past year. This is actually very low for annual growth, caused, obviously by the almost half a million drop this month. Just another statistic of a never ending shrinking labor force size showing not enough growth in relation to the overall population.
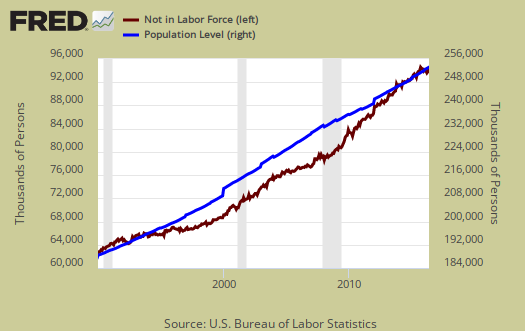
Below is a graph of those not in the labor force, (maroon, scale on the left), against the noninstitutional civilian population (blue, scale on the right). Notice how those not in the labor force crisscrosses the noninstitutional civilian population in growth. The civilian noninstituitonal population is from where all other labor statistics have sprung, so to see strong acceleration in those not counted as participating in the labor force than the pool of population possible to be part of the labor force in the first place isn't a great sign.
Below is a graph of the civilian labor force, or the official employed plus unemployed, in maroon, scale on left, against those not in the labor force, in blue, scale on right. See how those not in the labor force as a trend exceeded those considered employed and unemployed starting around mid 2009. Starting in 2014 it has reverted back, yet look at how is oscillating starting in 2015. To have a solid employment situation those not in the labor force should be growing less than those obtaining jobs and being counted as looking for work. Those not in the labor force does include retirees and students and there is a baby bump with both of these segments of the population.
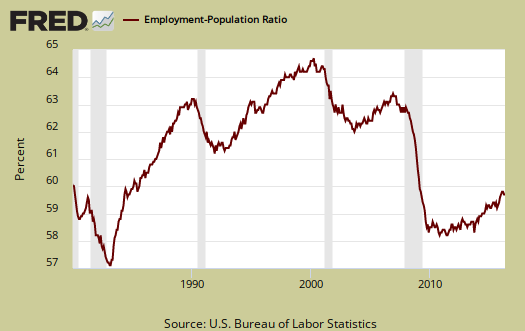
Those considered employed as a ratio to the total Civilian noninstitutional population now stands at 59.7%. Although this is no change from last month the level has not seen since 1985 (ignoring the financial crisis aftermath). In January 2008, this figure was 62.9%. The relationship between the employment-population ratio and the labor participation rate (LPR) is: employment-population ratio = LPR * (1 - unemployment rate).
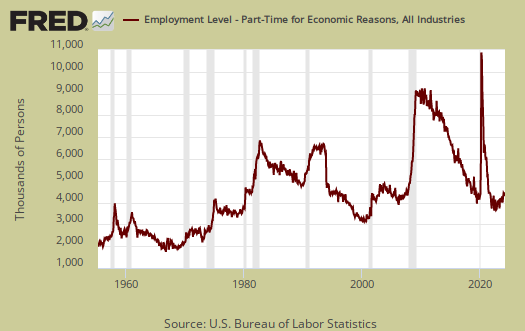
Those forced into part time work for economic reasons stands at 6,430,000 people. This is a change of 468,000 from last month and a very bad sign. The annual decrease is now just -170 thousand. This is the other really bad economic sign of this report.
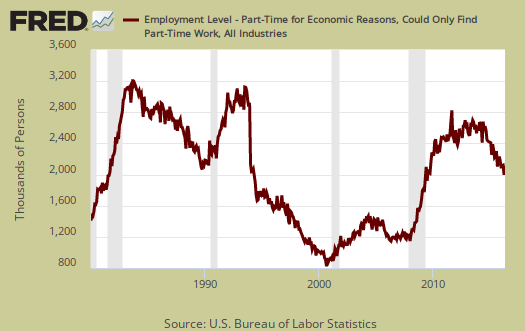
There are two categories of those forced into part-time jobs due to economic circumstances. Those who could only get part-time jobs and those already working who got their hours cut due to businesses not having enough work for them. The number of people who could only get part-time jobs stands at 2,086,000 as shown below. This is a monthly gain of 77 thousand for the month. A year ago, the number of those stuck in part-time jobs was 2,371,000.
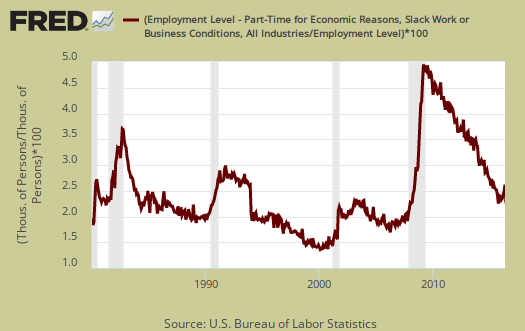
People can also work part-time hours due to slack business demand. People who got their hours cut due to slack working conditions stands at 3,890,000, a 181,000 increase from last month and a truly terrible sign. Below is a graph of forced into part-time work because they got their hours cut, as a percentage of the total employed. This is a recession economic indicator as weak economic demand forces businesses to reduce the working hours of employees.
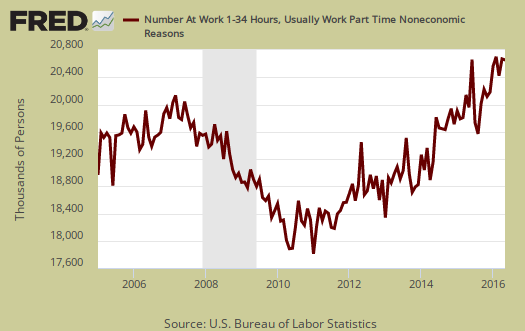
Part-time workers who are voluntarily working part-time jobs stands at 20,606,000, a monthly increase of 137,000. A year ago those working part-time numbered 19,950,000.
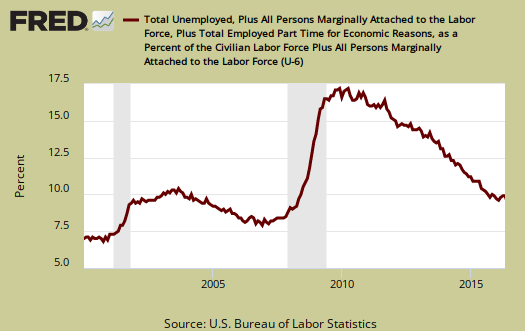
U-6 still stands at 9.7%, which is no change from last month. U-6 is a broader measure of unemployment and includes the official unemployed, people working part-time hours because that's all they can get and a subgroup not counted in the labor force but are available for work and looked in the last 12 months. The U-6 rate still leaves out some people wanting a job who are not considered part of the labor force, so while it is called an alternative rate, but it still ignores many who should be counted as unemployed.
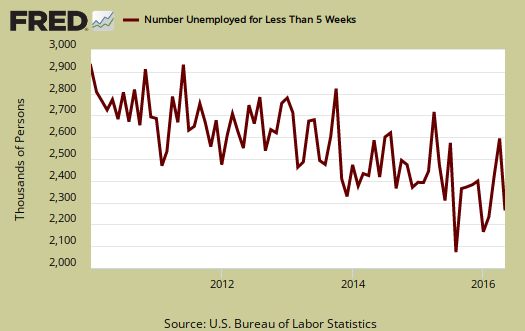
The newly unemployed stands at 2,207,000, a -338 thousand monthly decrease and a large good reason for the drop in unemployed. This means less people became newly unemployed, which normally would be a good thing, except this month they seemed to just drop out of the labor force entirely. Statistically speaking, BLS CPS data series are independently calculated, hence one cannot conclude what happened here, except to wait for a few months to see if there is a trend. Below is a graph of those unemployed for less than five weeks.
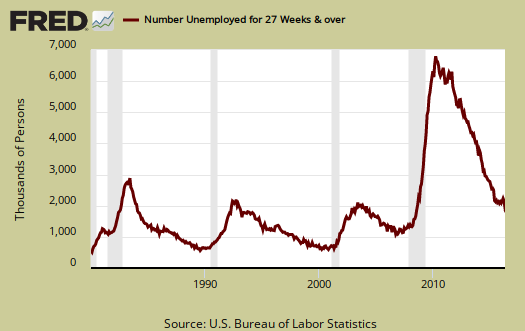
The long term unemployed, or those unemployed for 27 weeks and over, is 1,885,000 people. This is a -178 thousand monthly decrease, a very large number and could in part show these people simply dropped out of the labor force versus found jobs. From a year ago the long term unemployed ranks has declined by -190,000.
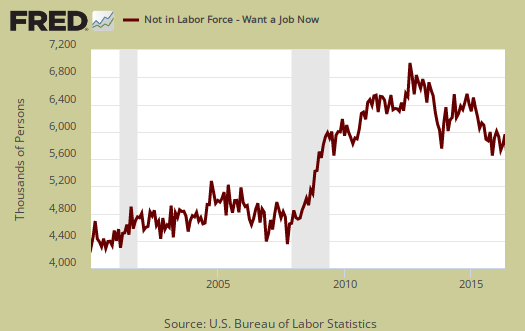
Within the CPS survey is how many people who are considered not in the labor force who report they want a job now. It is a direct survey question. The Census asks people who are not being counted in the unemployment statistics and official unemployment rate if they want a job. The number who answer yes currently stands at 5,923,000. Those not in the labor force who report they want a job declined by -24 thousand from a year ago. For the month those not considered part of the labor force who said they wanted a job increased by 130 thousand. This is another horrific sign for that is a monthly increase of 2.2% Those who are not counted yet report they want a job includes the discouraged workers and marginally attached and is seasonally adjusted.
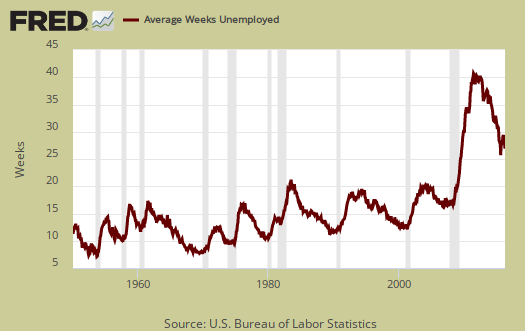
The average length of unemployment is 26.7 weeks, a drop of one week from last month. The average time to be unemployed has stayed completely out of alignment with the median duration. A year ago the average duration of unemployment was 30.5 weeks.
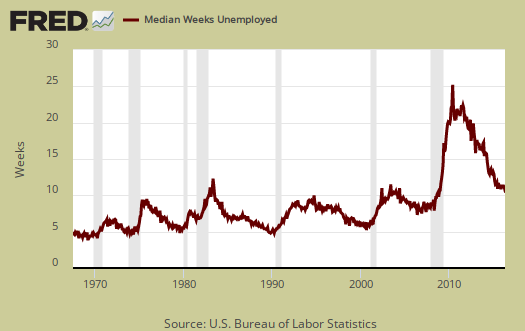
The median time one is unemployed, which means 50% of people have gotten a job in this amount of time is 10.7 weeks, a change of -0.7 weeks from last month. A year ago the median time to be unemployed was 11.6 weeks.
This month's CPS report by itself has some ominous signs that the economic mailaise is now showing up in labor statistics. Normally one would rejoice at such a low unemployment rate but in this case, having a low rate because there are fewer in the labor force is no reason to celebrate. We predicted this would happen last month and now we predict more of the same going forward. This question accompanies the usual caveat of the CPS being notoriously volatile with 100,000 data size swings routine from month to month. Here are our past overviews CPS unemployment statistics, only graphs revised.
Recent comments