Mr Trump was in Europe last week for the annual meeting of the G-20, the heads of government for the world's 20 largest economies. Part of Trump's agenda on that trip was to promote exports of US natural gas in Europe, with the apparent intention of undermining Russian dominance of natural gas markets on the continent. The groundwork for this natural gas scheme was laid in late June, when the US Senate voted 98 to 2 to impose further sanctions on Russia, with the intention of waylaying the construction of the Nord-Stream 2, a subsea natural gas pipeline planned from Russia to Germany, which international energy firms are involved in. To an extent, the Europeans went along with that scheme, extending their own energy sanctions against Russia to January 31st, 2018. Nonetheless, I found this entire stratagem bizarre and self-defeating; as you may recall, I've previously pointed out that our natural gas supplies are a lot tighter than they appear to be, and there's no way that additional supplies can be developed at the prices that are being promised for these exports. What I'm going to do today is show you the natural gas data that I'm looking at, so you can see how I've come to that conclusion.
The first screenshot below is from the EIA table of US dry natural gas production monthly, which I've lopped off at 8 years because the long history of US natural gas output is not an issue here. We can see that US natural gas production rose each year between 2010 and 2015 as fracking brought on new supplies. But look at the 2016 data starting in March; US natural gas production is lower each month of 2016 after that than the equivalent month of 2015. Likewise, for the first four months of 2017 for which there is confirmed production data, our natural gas production was again lower. That means our natural gas production had been falling year over year for 14 months in a row going into April, and since recent natural gas drilling and fracking remains far below that of the boom years, we have every reason to believe that decrease in output has continued to the present. Yet even the Reuters article on the Trump promotion of our natural gas exports refers to "fast-growing supplies of U.S. natural gas", a myth that every one in the media seems to believe without question. Here's the data; you can see our production is clearly falling:
Next, we'll include excerpts of a few tables on US natural gas exports. First, like the above, is a truncated excerpt of the EIA table of US natural gas exports. No surprise here, they've been rising, and now at a much more rapid pace since Cheniere's Sabine Pass natural gas natural gas liquefaction facilities started exporting LNG in May of last year..
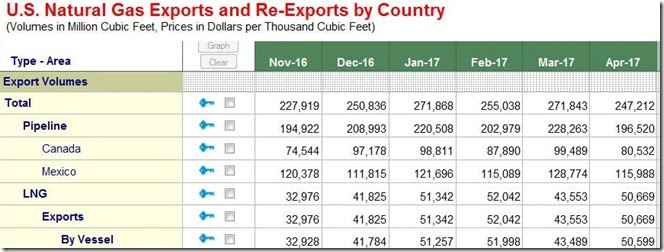
Just to put those exports into perspective, we'll include the top of the table of US natural gas exports by country. While you can see which countries our exports are going by looking at the entire table, we dont particularly care where they're going to, as we're including this table because it shows exports by pipeline (which obviously can only go to Canada and Mexico) and LNG exports by vessel, which are going all over the world...
Next, we have a truncated excerpt of the EIA table of US natural gas imports. Looking closely at the numbers, you'll see that our natural gas imports generally fell between 2010 and 2014 when our production was rising, but that our imports of natural gas started increasing again as our production fell and our exports rose. Comparing this table to the export table above, you'll see that during the winter months, when much of the US is using natural gas for heat, our imports of natural gas exceed our exports of it. For instance, in December 2016, we exported over 250 billion cubic feet of natural gas, and imported over 280 billion cubic feet of it. On the other hand, in April, when the US consumption of gas for heating and cooling is moderate, our natural gas exports did exceed our imports by around 9 billion cubic feet. The EIA projects that we will still be a net importer of natural gas in 2017, and not become a net exporter of natural gas until 2018.
Next, to put our imports in perspective we have the top of the EIA's table of US natural gas imports by country. What you see here is that almost all of our imported natural gas is now coming from Canada. Since we are still importing more natural gas than we're exporting, that means that we are, in effect, importing natural gas from Canada to export it through Texas and Louisiana. Without Canadian gas coming in to replace what we export, a shortage of natural gas would develop in the US. It should also be clear from what we've shown so far that for us to export any more natural gas to Europe, much less replace what they get from Russia, we'd have to first import more of it from Canada..
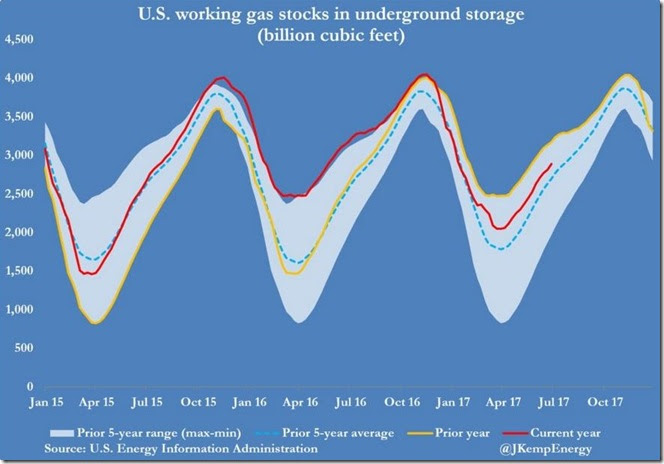
Next, let's look at a graph of natural gas supplies that we have stored underground:
The above graph comes from the twitter feed of John Kemp, senior energy analyst and columnist with Reuters, wherein the red line shows our natural gas supplies in billions of cubic feet from January 2015 to June 30th of this year. The yellow line, for the year prior to the one shown by the red line, thus shows our natural gas supplies in billions of cubic feet from January 2014 to the end of 2016, thus retracing some of what the red line shows. The light blue band then shows the prior 5 year range of our natural gas supplies, and thus from the left shows the range of our natural gas supplies from January 2010 through January 2014, extending to the right where it ends with the range of our natural gas supplies from the end of 2012 through the end of 2016. Lastly, the blue dashes show the average of that 5 year range of our natural gas stocks that's indicated by the light blue shading. Note the obvious seasonal pattern; surplus natural gas is injected into storage each spring and summer, then withdrawn for use during the heating season...
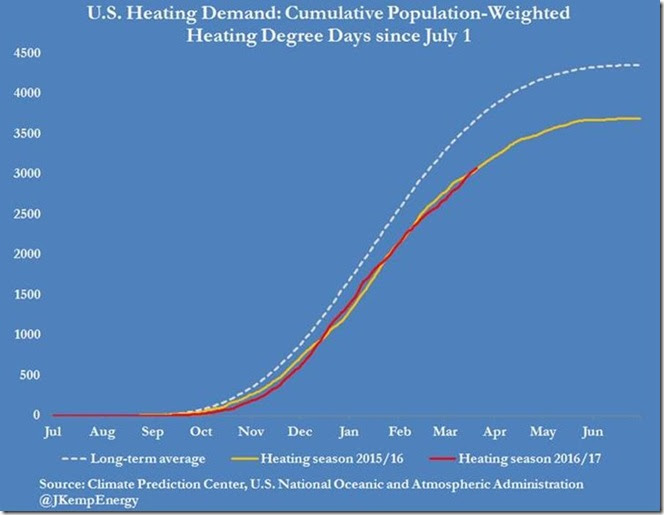
Just from looking at that graph, it appears that our natural gas supplies remain near normal, slightly above the average of the 5 year range. But next, we're going to pull out an old graph from the heating season that will call that simple visual analysis into question....this is a graph we posted on March 26th, showing heating demand for this past winter in red and heating demand for the winter before that in yellow, and the long term average heating demand as a light dashed line. A detailed explanation of what heating degree days are and what this chart shows is included with the original post, but suffice it to say that what this chart shows is that demand for natural gas for heating was 17% below normal in each of the last two winters. With that in mind, look back at the above graph of our natural gas supplies. By following the red line, we can see that our natural gas supplies were at least at a 5 year high for the time of year from October 2015 through November 2016, with October 2016 being the first time in our history that natural gas supplies topped 4 trillion cubic feet. That's normal, we'd expect a record glut of natural gas with demand for heating 17% below normal. But notice that since December of 2016 our natural gas supplies were falling at a faster rate than normal, despite another warmer than normal winter, and by the end of January had returned to merely average. Our supplies then recovered to above average because of a record warm period that led to the first weekly injection of gas into storage in February history, but as of this date they're still nearly 300 billion cubic feet below where they were at the same time in June a year ago. What that means is that at the current pace of natural gas production, we were unable to maintain our surplus from production at a the same pace as last year, even while demand remained below normal. What that suggests is that should domestic demand for natural gas jump to above average levels, either due to increased electrical generation or due to a colder than normal winter, our production plus Canada's imports will be inadequate to meet our export contracts and our own needs at the same time.
note: the above was excerpted from my weekly synopsis at Focus on Fracking


Comments
glad to see this
The propaganda drumbeat machine of the whatever they are political groups drowns out anything and everything off whatever message they wish to pound out.