
The August 2013 Federal Reserve's Industrial Production & Capacity Utilization report shows a 0.4% increase in industrial production. Manufacturing alone increased 0.7% for the month, but July manufacturing factory output was revised down to a -0.4% monthly change. Utilities fell again for the 5th month in a row and August shows a -1.5% decline, while mines increased 0.3%. The G.17 industrial production statistical release is also known as output for factories and mines. The graph below shows industrial production index, still not recovered to pre-recession levels, going on five years and seven months.
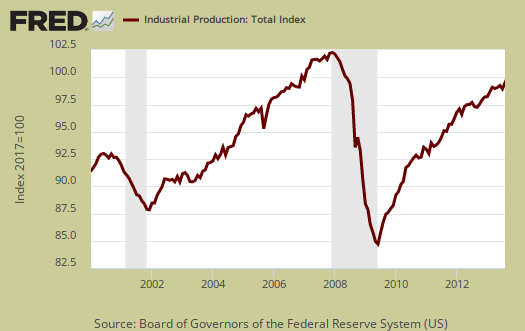
Total industrial production has increased 2.7% from a year ago and is still down -0.6% from 2007 levels, that's over six years. Here are the major industry groups industrial production percentage changes from a year ago.
- Manufacturing: +2.6%
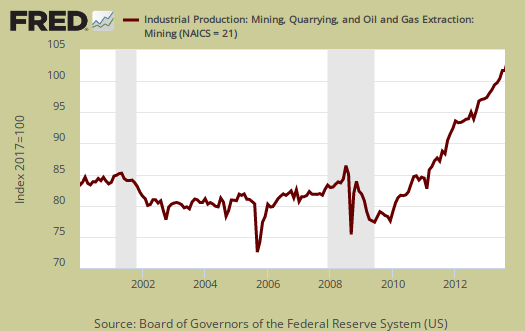
- Mining: +7.5%
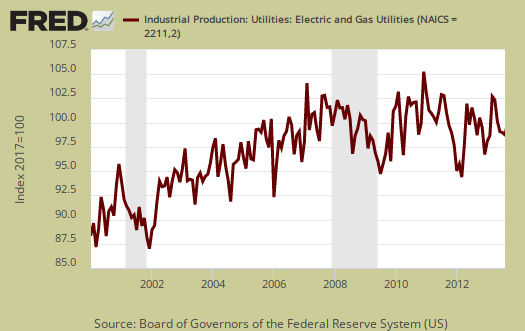
- Utilities: -3.9%
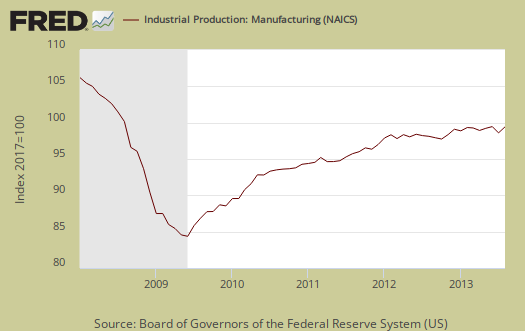
Manufacturing output alone shows a 0.7% monthly change, yet is still 2.6 percentage points below it's long run average. In other words, just because manufacturing had a good month, doesn't mean factory output is by any means healthy. Below is a graph of just the manufacturing portion of industrial production.
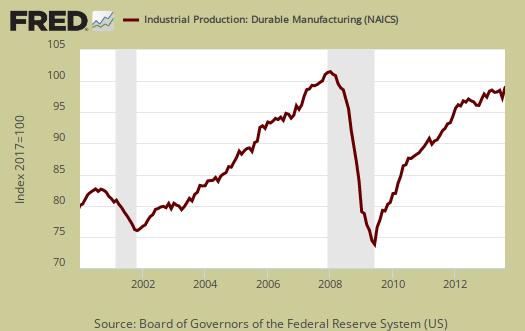
Durable goods increased 1.6% for the month, but July was revised down, -0.6%. This month motor vehicles & parts output, shot up 5.2%, after last month's bust of -4.5% . From the report we see other durable goods areas had a solid month for a change:
In August, the indexes for wood products; computer and electronic products; electrical equipment, appliances, and components; aerospace and miscellaneous transportation equipment; and furniture and related products all posted increases in the range from 1.0 percent to 1.7 percent.
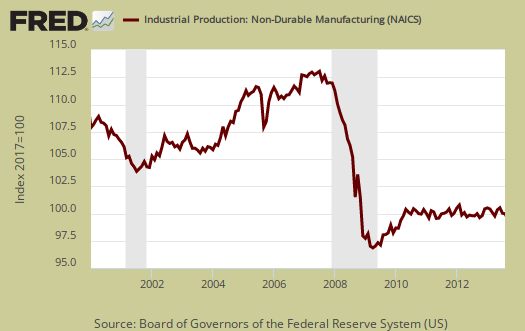
Nondurable goods manufacturing increased only 0.1% and has been generally flatline as the annual increase for nondurable goods output has been 1.5%. Nondurables is also dragging down the overall manufacturing index as nondurable goods is 3.3 percentage points below it's long term average.
Mining has really grown in the United States, primarily on oil and gas extraction and this month is no exception, with a 0.3% monthly increase and a 7.5% increase from a year ago. Mining is also fueling the North Dakota economic miracle.
Utilities are another story and notice how declines in utilities align with recessions and also how, even though seasonally adjusted, there is quite a bit of variance month to month. Businesses, needless to say, utilize utilities.
There are two reporting methodologies in the industrial production statistical release, market groups and industry groups. Market groups is output bundled together by market categories, such as business equipment or consumer goods. Industrial output is by NAICS codes and is for all manufacturing, or all types of durable goods manufacturing*. Below is the Fed's description of Market groups from the report and their monthly percent changes. Looks like automotive is the bright spot in the otherwise ho hum industrial production figures.
The production of consumer goods increased 0.3 percent in August after having decreased 0.5 percent in July; in August, the index stood 2.3 percent above its year-earlier level. As a result of a rebound in automotive products, the production of durable consumer goods rose 2.5 percent to reverse a similarly sized decline in July. The indexes for appliances, furniture, and carpeting and for home electronics also posted gains in August, while the output of miscellaneous goods was unchanged for a second month in a row. The index for consumer nondurables declined 0.3 percent in August, its fifth consecutive month without an increase. The output of non-energy nondurables was unchanged; gains for foods and tobacco and for clothing offset losses for chemical products and for paper products. After having moved up 1.7 percent in July, the output of consumer energy products moved down 1.5 percent in August, with decreases for both fuels and utilities.
After a decrease of 0.9 percent in July, the index for business equipment reversed that loss with an increase of 0.9 percent in August; production was 2.5 percent above its level of a year earlier. The index for transit equipment moved up 3.6 percent, the production of information processing equipment rose 1.2 percent, and the index for industrial and other equipment edged down 0.2 percent.
The output of defense and space equipment rose 1.0 percent in August following a decline of 0.1 percent in July. The index for August stood 0.8 percent above its year-earlier level.
In August, the output of construction supplies advanced 0.3 percent, its third consecutive monthly increase, and the index was 5.3 percent above its level of a year earlier. The production of business supplies was unchanged in August and little changed from its year-earlier level.
The production of materials to be processed further in the industrial sector increased 0.4 percent in August and was 3.4 percent above its year-earlier level. The output of durable materials rose 1.0 percent in August. The production of consumer parts advanced 2.5 percent after two consecutive monthly declines, and the output of equipment parts rose 1.7 percent. The production of nondurable materials moved up 0.7 percent; textile, paper, and chemical materials each registered gains of 0.6 percent or more. The output of energy materials decreased 0.3 percent; the index for this market group was 4.4 percent above its level of a year earlier.
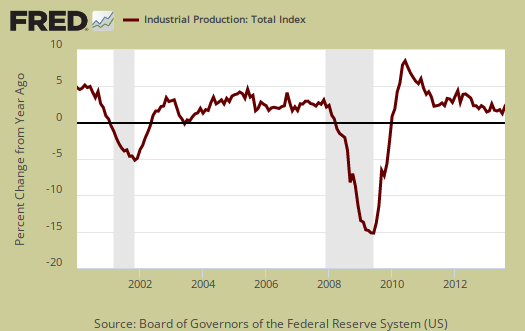
Below is graph of overall industrial production's percent change from a year ago. The Federal Reserve gives long term averages but economic malaise has been going on so long, 2008-2012 are part of those averages now.
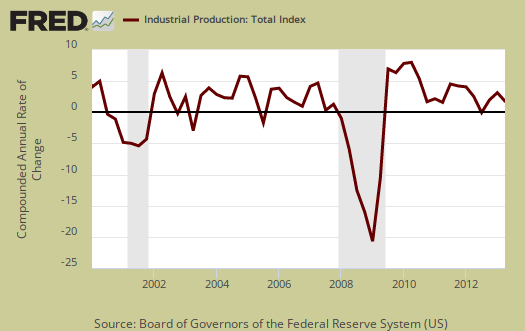
The third quarter for Industrial production is starting to shape up to be not so bad, although we can see industrial production is often revised. Industrial production does have some correlation to GDP components, but not always, so this month's change will still imply no bad news is good news for economic growth. The below graph is the industrial production index by quarters, up to Q2 2013.
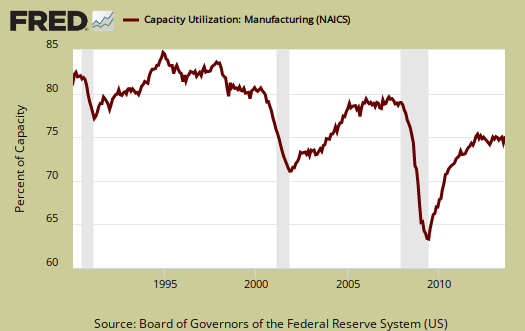
Capacity utilization, or of raw capacity, how much is being used, for total industry is 77.8%, a 0.2 percentage point monthly increase. How much plants are utilized is now 2.4 percentage points below the average from 1972 to 2012. Capacity utilization has decreased -0.6 percentage points from a year ago. Manufacturing capacity utilization is now 76.1% and is 0.7 percentage points higher than a year ago. Mining capacity utilization is 90.0% and is up 2.8 percentage points from a year ago. Utilities use of it's capacity is 74.7% and this is a decline of -3.8 percentage points from a year ago and a -1.1 percent point drop in a month for electrical and gas operating rate. Manufacturing capacity utilization declines are not good news. Utilities are electricity and gas and there are large inventories as of late stock piling up as milder weather plus alternative energy have greatly reduced demand.
Capacity utilization is how much can we make vs. how much are we currently using, of what capacity is available now, or output rate. It is also called the operating rate. Capacity utilization is industrial production divided by raw capacity.

Capacity growth is raw capacity and not to be confused what what is being utilized. Instead, this is the actual growth or potential to produce. Capacity is the overall level of plants, production facilities, and ability to make stuff, that we currently have in the United States. Capacity growth overall has increased 1.8 percentage points from a year ago, the same as the previous two months Below is the capacity growth increase from a year ago of the subcategories which make up industrial production.
- Manufacturing: +1.5%
- Mining: +4.2%
- Utilities: +1.1%
According to the report for 2012, manufacturing uses 77.4% of capacity, with durables about 39.7%. Utilities use 9.9% and mining 12.7% in 2012 (rounded) to give a ratio of manufacturing vs. mining and utilities in terms of capacity. High tech uses 3.7% of total industrial production capacity. Below is the Manufacturing capacity utilization graph, normalized to 2007 raw capacity levels, going back to the 1990's. Too often the focus is on the monthly percent change, so it's important to compare capacity utilization to pre-recession levels and also when the economy was more humming.
Here are our previous overviews, only graphs revised. The Federal Reserve releases detailed tables for more data, metrics not mentioned in this overview. If you are baffled by what crude, finished mean from the G.17 report, read these stages of production definitions. Stages of production have implications for exports and imports. Finishing industrial production implies goods for final sale and thus what kind of output one will see for the month. From the report:
Capacity utilization rates in August for industries grouped by stage of process were as follows: At the crude stage, utilization was unchanged at 87.8 percent, a rate 1.5 percentage points above its long-run average; at the primary and semifinished stages, utilization increased 0.1 percentage point to 75.7 percent, a rate 5.3 percentage points below its long-run average; and at the finished stage, utilization moved up 0.4 percentage point to 75.8 percent, a rate 1.3 percentage points lower than its long-run average.
*From the Federal Reserve definition details:
Market groups consist of products and materials. Total products are the aggregate of final products, such as consumer goods and equipment, and nonindustrial supplies (which are inputs to nonindustrial sectors). Materials are inputs in the manufacture of products. Major industry groups include three-digit NAICS industries and aggregates of these industries-for example, durable and nondurable manufacturing, mining, and utilities./blockquote>
Recent comments