
Other than the employment situation, the key economic release of the past week was our International Trade in Goods and Services for May (pdf) from the Census bureau, which showed that our trade deficit grew by 12.1% as our exports slumped and our imports jumped from the levels of April. Seasonally adjusted May exports of $187.1 billion, $0.5 billion less than revised April exports of $187.6 billion, combined with May imports of $232.1 billion, $4.4 billion more than April imports of $227.7 billion, resulted in a May goods and services deficit of $45.0 billion, up from $40.1 billion in April. Our seasonally adjusted trade deficit in goods increased by $5.0 billion, as exports of goods decreased $0.9 billion to $130.3 billion, and imports of goods increased $4.2 billion to $193.7 billion, while our trade surplus in services increased by $0.2 billion. Exports of services increased by $0.4 billion to $56.8 billion, and imports of services increased $0.2 billion to $38.4 billion. On an unadjusted basis, our goods deficit was at $64,887 billion in May, a bit more than the $63,400 billion seasonally adjusted amount.
The change in imports of goods from April to May reflected increases of imports in all end use categories. Imports of industrial supplies and materials rose $1.05 billion to $57.184 billion, on a $713 million increase of crude oil imports, and $682 million of other petroleum products, while imports of natural gas fell $250 million; this despite the fact that oil prices averaged $96.84 in May, down from $97.82 in April, and down from $108.06 a year ago. Imports of consumer goods rose $1.03 billion on a $1,890 million jump in cell phone imports, while imports of pharmaceuticals fell $967 million and TV & video equipment imports fell $181 million. Automotive vehicles, parts, and engines accounted for another $788 million increase in imports, while imports of foods, feeds and beverages rose $370 million to $9.919 billion, on increases of $178 million of fish and shellfish, $111 million in fresh fruits and juices, and $98 million of green coffee beans, while imports of meat products fell $111 million. In addition, imports of capital goods rose $347 million to $45.694 billion, on $269 million more computer accessories, $211 million more in imported civilian aircraft, and a $198 million increase in imported semiconductors, offset by $225 million of declining imports of telecommunications equipment and $261 million less in civilian aircraft engines. In addition, imports of other goods not included in an end use category rose $0.5 billion.
Changes in exports of goods from April to May included a $1.2 billion decrease in exports of consumer goods to $13.06 billion, led by a $757 million decrease in exports of jewelry and a $512 million decrease in exports of gem diamonds; this was partially offset by a $97 million increase in exports of pharmaceuticals. A $0.9 billion decrease in exports of industrial supplies and materials, led by a $1,130 million decrease in exports of non-monetary gold and a $229 million decrease in exports of organic chemicals was partially offset by a $439 increase in exports of fuel oil. A $0.1 billion decrease in exports of and foods, feeds, and beverages, including $72 million less wheat exports, $66 million less oil & oilseeds exports, and a $65 million decrease in exports of soybeans, was partially offset by a $69 million increase in exports of dairy products and eggs. End use categories that saw exports increase included an $0.8 billion in capital goods exports, where exports of civilian aircraft rose $1,365 million to $5,115 million, exports of telecommunication equipment fell $373 million to $3,160 million, and exports of autos engines and parts rose $320 million to $13.06 billion. In addition, exports of other goods not otherwise categorized rose $172 million to $5.015 billion.
Our trade with China accounted for $27.9 billion of the unadjusted $64.9 billion May deficit in goods, which was up from $24.1 billion in April. Other major bilateral trade deficits on an unadjusted basis in May, include a $10.8 billion deficit with the European Union, a $6.3 billion deficit with OPEC, $5.8 billion with Germany, $5.4 billion with Japan, $5.3 billion with Mexico, $2.7 billion with Saudi Arabia, $2.5 billion with South Korea, $2.3 billion with India, $2.3 billion with Ireland, $1.9 billion with Canada, and $1.5 billion with Venezuela. Small bilateral trade surpluses were recorded with Hong Kong at $3.0 billion, Australia at $1.4 billion, Singapore at $1.2 billion, and Brazil at $0.9 billion.
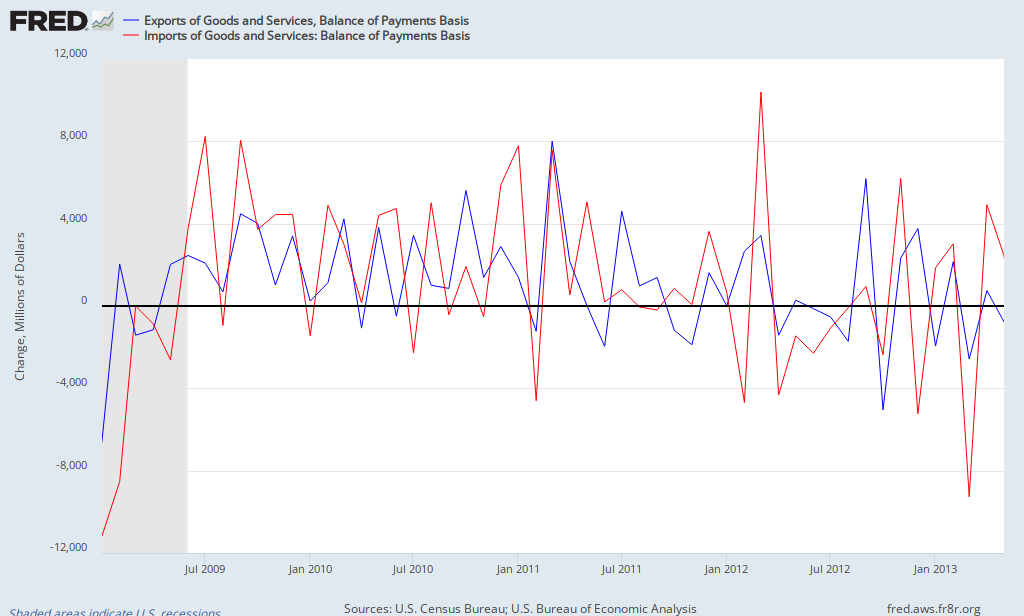
Our FRED graph above shows the monthly changes positive or negative, in exports in blue, and the monthly change in imports in red. You should remember from our GDP coverage that an increase in exports adds to the GDP change, and a decrease in exports subtracts from it, while an increase in imports subtracts from GDP, while a decrease in imports adds to it. This 12.1% increase in our May trade deficit, on the heals of a 8.5% wider trade shortfall in April, this virtually assures negative impact from net trade on 2nd quarter GDP. Indeed, forecasters are already writing that in; after this report, Goldman Sachs cut its estimate for second quarter GDP growth by 0.2% to 1.6%, while Barclays was even more bearish, cutting their 2nd quarter estimate from 1.6% to 1.0%…
(crossposted from Marketwatch 666)
Comments
trade deficit, China
China's deficit is highly cyclical, so going off the monthlies isn't too good of an idea. Yet, annually, it has jumped already and last year was another record high.
I am noticing U.S. exports seem to be more in trouble and that along with manufacturing losing even more jobs makes me suspect even more jobs are being offshore outsourced.
I'm so glad you wrote about this. It is astounding how Wall Street and our lovely political leaders completely ignore the trade deficit and obviously it is negatively impacting U.S. economic growth.
cant reduce the federal deficit with a trade deficit like this
in an earlier post, i explained that a trade deficit forces either or both the federal government or the private sector further into debt, cause every dollar of foreign surplus is always offset by either government or private sector deficits...
as long as the US continues to run trade deficits, it is impossible for the federal government to balance its budget while the private sector is deleveraging...every dollar of private sector surplus is always offset by a government sector deficit, and vice versa; its an accounting identity...therefore reducing government deficits will of necessity reduce private sector surpluses accordingly...this can best be seen on the adjacent chart from Goldman's chief economist Jan Hatzius...what you see here is that the financial balance of three sectors (private, government, and foreign) always and must net out to zero; because one sector’s income is always another sector’s spending...
rjs
amazing how it is ignored
interesting link, but yeah, hello, accounting 101, and imports subtract. Why I put the GDP equation in every GDP overview!