
Included below is a table taken from the retail sales report for September; notice that the 3 month change in sales from the 2nd quarter to the 3rd quarter is in the third column, and the change from the 3rd quarter from a year ago is in the 4th column. Now notice that seasonally adjusted sales for the July to September period are up 1.1% over the April to June period, and up 4.4% over the July to September period of a year earlier. Once adjusted for inflation, we can use retail sales data to give us a precursor of how these sales will affect GDP. As we've often noted, roughly 70% of GDP is personal consumption expenditures, and although the lion's share of that is spending for services, durable goods accounts for roughly 11% of personal consumption and spending for non-durables, such as food, gasoline, and drugs, makes up 23% of PCE. However, to get a rough approximation how 3rd quarter retail sales, as shown above, might impact real GDP, we'll have to adjust those sales for inflation. Coincidentally, the bureau of labor statistics released the consumer price index on Wednesday, the day after commerce released the advance retail sales data..

So, the BLS reported that the seasonally adjusted CPI for all urban consumers rose 0.2% (or at a 2.2% annualized rate) in September, with energy accounting for about half of the month's price increase. Thus, in a very crude estimate, we can say that real retail sales declined 0.3% over the month; as dollar value sales fell 0.1% and the amount a dollar could purchase fell 0.2%. In fact, that simple metric is included in the data that the NBER Business Cycle Dating Committee weighs when they make official recession calls.. But we'd also like to take this inflation data and apply it to how quarterly retail sales would be included in the GDP. As we saw in the retail table, retail sales were up 1.1% in the 3rd quarter. So we’d have to apply the corresponding inflation data to that. When we check the first CPI table, under the heading "Seasonally adjusted percent change", we see the CPI rose 0.2% in July, 0.1% in August, and, as reported, 0.2% in September. So in a likewise very crude estimation, we could say that real retail sales rose 0.6% over the quarter (1.1% minus 0.5%). But in addition to the inexactness of this estimate, we’d also have to add the caveat that since the CPI also includes prices for services, such as medical care, using the CPI isn't really the right method to use to adjust retail sales for inflation. For a proper adjustment, what we'd have to do is break out the quarterly sales of each item sold separately, and apply the price change data for that item to those sales to get real sales of that item. By way of example, retail sales for auto and other motor vehicle dealers were reported up 1.6% for the quarter (see the table). The CPI data overview shows that prices of new cars were up 0.1% in July, 0.0% in August, and 0.2% in September, while prices for used vehicles were down 0.4% in July, down 0.1% in August, and unchanged in September. So over the 3rd quarter, new car prices were up around 0.3%, while used car prices were down around 0.5%. We can also weigh their relative importance, as new car prices account for 3.133% of the CPI, and used car prices account for 1.910% of the index. So, in the aggregate, prices realized by motor vehicle & parts dealers were down by a statistically insignificant fraction over the quarter, and that means and and that means there’s no deflator for car sales: the entire 1.6% increase in sales at motor vehicle & parts dealers will contribute to the durable goods increase in the computation of GDP personal consumption expenditures, which would be recorded as growth at an annual rate of 6.55%. In like manner, to figure the contribution of sales at grocery stores to real non-durable goods PCE, we would have to adjust the 1.2% quarterly sales gain with the "food at home" component of the price index, which was up 0.2% for the quarter, and to figure the contribution of restaurant and bar receipts to the real PCE increase, it would be adjusted with "food away from home" prices, and so on. Of course, we wont do all of that here; we'll leave that to the computers at the BEA, which will release the GDP data next week..
Modest Changes in Consumer Prices for September
At any rate, the seasonally adjusted September CPI was 0.2% above August's, and just 1.2% above it's level of a year ago; the unadjusted index, based on 1982 to 1984 prices equal to 100, was at 234.149, up from 233.877 in August and 231.407 a year earlier. The energy index was up 0.8% for the month, but still remained 3.1% below it's September 2012 level. Gasoline was up 0.8%, fuel oil prices increased 0.9%, electricity cost 0.5% more, and utility natural gas rose 1.8% from August's level. Meanwhile, the food price index was unchanged for the month, as both the food at home and food away from home registered no aggregate change. Of the foods purchased for use at home, cereals and baked goods increased by 0.2%, as white bread prices rose 0.7% and prices for the rice, pasta, and cornmeal group fell 0.9%. The meat group prices rose 0.1%, with hot dogs up 2.7%, fresh fish up 2.1%, beef and veal down 0.3%, and eggs down 2.5%. Dairy products were also up 0.1%, with whole milk down 0.2% and ice cream up 1.0%, while prices for fruits and vegetables fell 0.9% for the month, with apples down 3.7%, oranges down 1.7% and tomatoes up 3.1% over August's seasonally adjusted prices. Meanwhile, aggregate prices for beverages were down 0.2% and the catch all "other foods" group rose 0.4%.. With the food index accounting for just over 14% of the CPI and the energy index over a tenth of the total, that left the core price index, which is all items except food and energy, up 0.1% for September and 1.7% above the level of a year earlier..
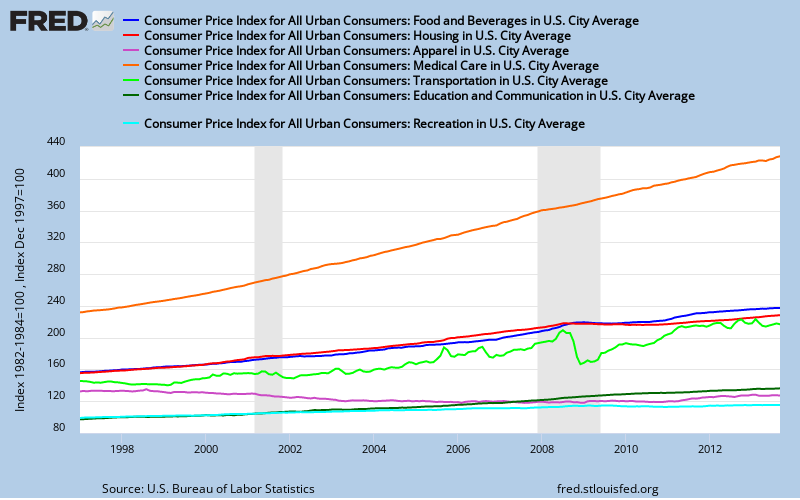
The core prices that increased in September included the cost of shelter, which was up 0.2% over August as both major components, rent and homeowner's equivalent rent, increased by that same 0.2%, while prices for lodging away from home fell 0.4%, Medical care services rose 0.3% as doctor's fees rose 0.1% and hospital changes rose 0.7%, while medical commodities were up just 0.1% as prescription drug prices rose 0.2%. Transportation services rose 0.3% as maintenance and repair costs rose 0.2%, public transportation rose 0.9%, car insurance rose 0.2% and vehicle fees were unchanged, while the price index for transportation commodities rose 0.1% as new car prices were up 0.2% and prices for used vehicles were unchanged. The education and communication price index was also up 0.1% in September, as education commodities rose 0.4% behind a 1.5% price increase for college textbooks, while education and communication services edged up 0.1% as college tuition fell 0.3%. Of the major price indexes that declined in September, the recreation index edged down 0.1% as prices for recreation commodities fell 0.7% with TVs down 1.3% and photographic equipment down 2.5%, while recreation services rose 0.3%, led by a 1.7% hike in pet services. Finally, the clothing index fell by 0.5% for the month, as women's and girls' apparel prices fell 1.0% and footwear prices were 0.7% lower. Our FRED graph below shows the historical track of these major aggregate price indexes going back to 1997, when the education and recreation indexes were reset. Price indexes based on prices from 1982 to 1084 = 100 include the price index for food and beverages shown in blue, the composite price index for housing, which includes rent or equivalent, maintenance, and utilities and accounts for 41.1% of the CPI, in red, and the clothing and apparel index in violet. Also based on prices from 1982 to 1984, the rising orange line is the medical care composite index, which is now now at 428.026, an increase of more than fourfold from the index years. Next, in light green, we have the volatile transportation index, which reflects the gyrating cost of gasoline and fuel related costs of transportation services, moderated by the slow steady rise in the cost of vehicles. Lastly, we have our two indexes benchmarked to 1997 prices equal to 100: education and communication price changes are shown in dark green, while the recreation index is shown in bright blue. (click to enlarge)
We should also note that with the release of the September CPI, it was possible for the Social Security administration to calculate the Cost of Living Adjustment (COLA) for this coming year, which is based on the price change of the CPI for Urban Wage Earners and Clerical Workers (CPI-W), (which is a subset of the CPI-U that tracks prices paid by 29 percent of the US population) for the months of July, August and September when compared to the CPI-W over the same months last year. That price change worked out to be 1.5%, so the 58 million seniors on Social Security, as well as millions of disabled veterans, federal retirees and those poor who get Supplemental Security Income will see a meager 1.5% increase in their stipends for next year. For some, that will barely make up what they lost with the food stamp cuts that went into effect on Friday. In addition, the wage threshold for payroll taxes, which fund social security, will increase to $117,000 next year. There will also be an inflation adjusted 1.7% increase in the income tax brackets, which means that the highest marginal tax rate of 39.6% wont kick in until taxable income of an individual exceeds $406,750 in 2014. And the dead will get an even greater increase than the elderly and the rich, as the individual estate-tax exclusion, which is now pegged permanently to inflation, will be $5.34 million in 2014, up from $5.25 million currently..
(cross posted from MarketWatch 666)
Comments
errata
i realize this post is somewhat incoherent, and there's a couple of reasons for that; first, i covered retail sales and CPI together as part of one post on my own blog, then tried to split the CPI coverage into a separate post to use here on the economic populist; second, i've had long running quiet disagreement with the way NBER and FRED & everyone else figures real retail sales, but didnt start explaining that until half way through the post...then i kind of backed into my alternative methodology, but since i didnt have time to work it out completely, i failed to follow through...
here's the bottom line: this FRED series is constructed incorrectly: Real Retail and Food Services Sales (RRSFS); the series is constructed by simply deflating "Retail and Food Services Sales" (RSAFS) using the Consumer Price Index for All Urban Consumers (CPIAUCSL).
we can't deflate retail sales with CPI; because in some months, it would mean deflating car sales because of higher rent, tuitions or medical costs...the only accurate way to deflate retail sales is by deflating each sales group with its corresponding price change; next time, if i have the time, i'll do it right..
rjs
Do inflators even exist?
I don't think these are published anymore, discontinued, but the closest would be to use the PCE deflator. Have to research the BEA to see how they treat retail sales as a consumer expenditure input of the NIPA.