
If you're looking for a job, it plain sucks to live on the West coast. The April 2012 State Employment statistics show the average unemployment rate for the entire Pacific region is 10.1%.
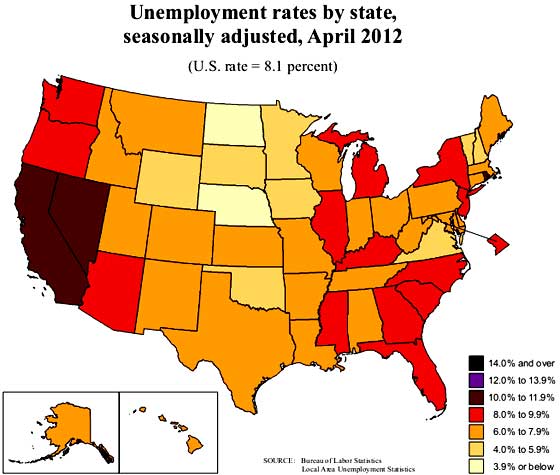
Above are the state unemployment rates for April 2012. Unemployment rates at this point do not give the whole story, for people have been dropping out of the labor force, hence are not counted as part of these ratios. If you follow this link, there is a map of the percent change in actual civilian labor force per state over the last year. This shows that some states' civilian labor force has significantly dropped since last year. This link shows the labor force percentage change over the past month. Even in that short period, some states civilian labor force dropped > 0.2%.
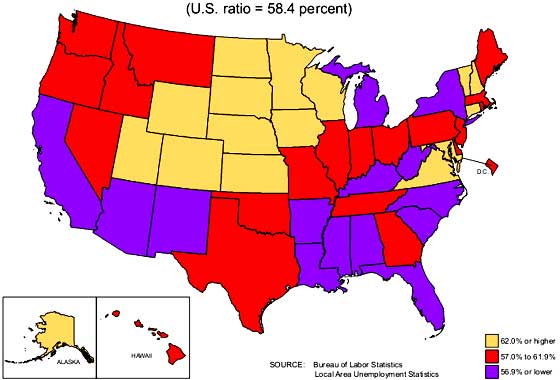
The map below shows the employment to civilian non-institutional population ratios, per state, on average for 2011. Notice how the below civilian population to employed ratio map follows the unemployment rate map. While demographics vary state to state, some have much higher retirees for example, it's clear people have dropped out of the count, out of the civilian labor force, who have not found a job.
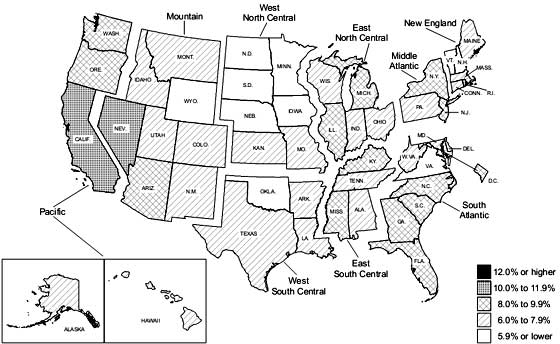
Below is the BLS unemployment map divided up into regions. As we can see, the Pacific does not include Nevada, which has the worst unemployment rate of 11.7%. California has an unemployment rate of 10.9% overall, yet in the Los Angeles area, the unemployment rate rivals Nevada, 11.6%. North Dakota's unemployment rate is an astounding 3.0%.
From the report:
Thirty-seven states and the District of Columbia recorded unemployment rate decreases, five states posted rate increases, and eight states had no change, the U.S. Bureau of Labor Statistics reported today. Forty-eight states and the District of Columbia registered unemployment rate decreases from a year earlier, while only one state experienced an increase and one had no change. The national jobless rate was little changed from March at 8.1 percent but was 0.9 percentage point lower than in April 2011.
What is more significant are the changes to payrolls. These are actual jobs and counted by different methods than the unemployment statistics.
Payrolls increased in 32 states plus the District of Columbia and declined in 18 states.
The largest over-the-month increase in employment occurred in Indiana (+17,100), followed by Texas (+13,200) and Georgia (+7,800). The largest over-the-month decrease in employment occurred in Maryland (-6,000), followed by Wisconsin (-5,900) and New Hampshire (-4,800).
Hawaii experienced the largest over-the-month percentage increase in employment (+0.8 percent), followed by North Dakota (+0.7 percent) and Indiana (+0.6 percent). New Hampshire experienced the largest over-the-month percentage decline in employment (-0.8 percent), followed by Alaska (-0.7 percent) and Vermont (-0.5 percent).
What is also amazing over an entire year, how little payrolls have really grown.
Over the year, nonfarm employment increased in 43 states and the District of Columbia and decreased in 7 states. The largest over-the-year percentage increase occurred in North Dakota (+7.2 percent). The largest over-the-year percentage decrease in employment occurred in Rhode Island (-0.9 percent).
Below is the map on the April 2011 to April 2012 nonfarm payrolls percentage change. Notice how many states have had < 1% payroll growth over the last year.
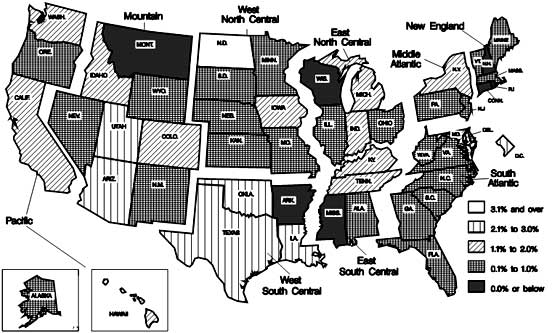
The bottom line is we not only have a jobs crisis, now going on past 4 years, we also have a regional disparity in terms of jobs markets. North Dakota can be explained by their oil boom. Rhode Island had problems before the recession, a combination of regulatory, tax, lower wages and higher costs of living, which simply make them not business competitive in comparison to their neighbors, a short drive away. Yet a poor business climate doesn't explain all of these regional differences.
For the month, Indiana's payrolls boom cause is not specifically known, although there are many auto manufacturers with plants in Indiana.
The BLS has more statistics per state at this link.
Here is our state employment report overview from last month, unrevised.
Recent comments